The Bitcoin price returned to its sideways price action following a powerful surge into new yearly highs. The cryptocurrency seems poised for further gains if bulls can hold a critical level.
As of this writing, BTC trades at $36,370, with a 2% loss in the last 24 hours. Over the previous week, the number one crypto by market capitalization recorded a 5% gain, while the sentiment in the sector looks mixed, with BTC recording losses as Ethereum and Solana stayed strong in the same period.
Bitcoin Likely To Bounce If This Scenario Plays Out
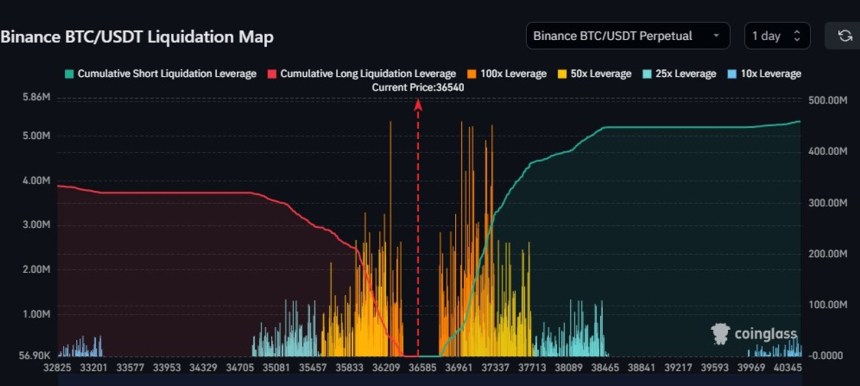
According to a pseudonym analyst, the liquidity in the Bitcoin spot market, measured by a “Liquidity Map,” has been allocated to the downside. This metric gauges the amount of leverage in the BTC/USDT trading pair.
The chart below shows that BTC is trading close to a huge liquidation cluster. Overleverage positions create these levels and are often tapped by big players to exploit the liquidity.
BTC whales chase liquidity, moving prices towards the biggest pools of overleveraged positions. If the $36,300 gets tapped, the next level of interest is located to the upside between $36,961 and $37,700. The analyst stated:
Big clusters at $36K and ~$37K. Would expect there to be quite some positions build up around that 37K region mainly as we chopped around it all day yesterday. Bears are back in control on the LTF (Low Timeframe) below $36.3K I’d say.

BTC Hits Local Top?
On the other hand, the Bitcoin price could trend sideways between $36,300 and the high of its current range. Additional data from crypto analytics firm Bitfinex Alpha indicates that historical data hints at bad news for optimistic traders.
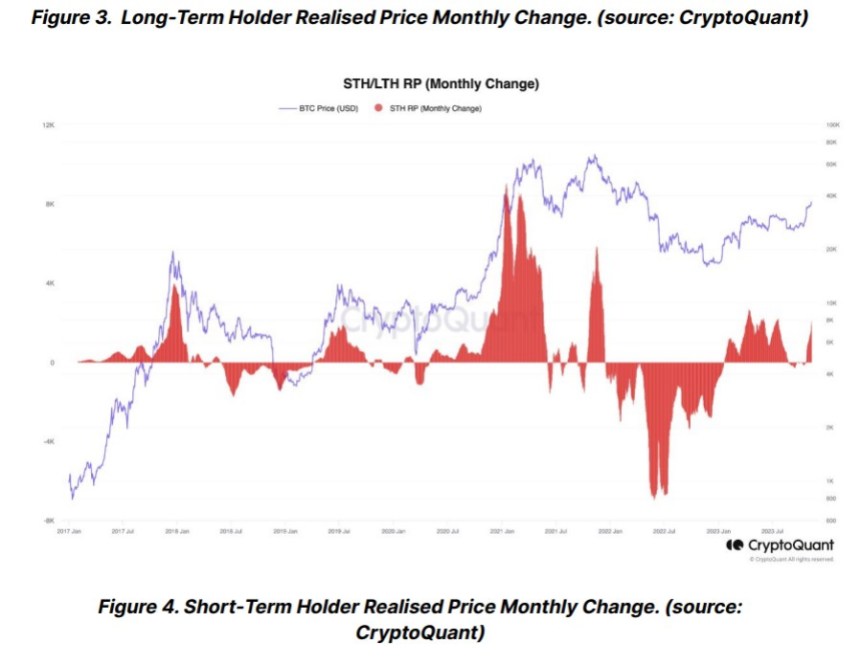
The firm advises caution for traders as the liquidity gap in the Bitcoin spot market increases. Per recent data, BTC Short-Term Holders Realized Price (STH RP) bought the cryptocurrency at an average price of $30,380, which could incentivize these investors to take profit at current levels.
This is the first time STH has had an opportunity to make a big profit on their BTC holdings since April 2022 and December 2022. Historically, a monthly change in STH RP exceeding $2,000 often signals local peaks, particularly post-recovery in bear markets, as seen in the chart below.

Concurrently, a negative monthly shift in LTH RP usually implies long-term holders are offloading their Bitcoin. The convergence of a $2,000 increase in monthly STH RP and a decline in LTH RP suggests a high likelihood of a local peak in Bitcoin’s price.
Cover image from Unsplash, chart from Tradingview
Credit: Source link


 Bitcoin
  Ethereum
  XRP
XRP  Tether
  Solana
  USDC
USDC  Dogecoin
  Cardano
  Lido Staked Ether
  TRON
TRON  Wrapped Bitcoin
  Wrapped stETH
  Chainlink
  Avalanche
  Sui
Sui  Stellar
  Litecoin
  Shiba Inu
  Toncoin
  Hedera
  LEO Token
  USDS
USDS  Hyperliquid
  Polkadot
  WETH
WETH  MANTRA
  Bitcoin Cash
  Ethena USDe
  Bitget Token
  Wrapped eETH
  Uniswap
  Monero
  NEAR Protocol
  Pepe
Pepe  WhiteBIT Coin
  Aave
Aave  Ondo
Ondo  Bittensor
  Aptos
Aptos  Internet Computer
  Dai
Dai  Official Trump
  Ethereum Classic
  Mantle
  Tokenize Xchange
  OKB
OKB  Gate
Gate  sUSDS
sUSDS  Coinbase Wrapped BTC
