An analyst has explained why it could be the time to get ready for a new Bitcoin bull run, based on the pattern developing in this on-chain metric.
Bitcoin US To The Rest Reserve Ratio Has Seen A Reversal Recently
In a CryptoQuant Quicktake post, an analyst discussed the recent trend in the BTC US to The Rest Reserve Ratio. This indicator tells us, as its name suggests, the ratio between the total Bitcoin reserves of the US-based centralized platforms and that of the global ones. Platforms here refer to not just the exchanges, but also other entities like banks and funds.
When the value of this metric is rising, it means the asset is currently moving from offshore platforms to American ones. Such a trend can be a sign of demand from the US-based investors. On the other hand, the indicator going down suggests the foreign platforms have higher demand for BTC right now as the American exchanges are losing dominance to them.
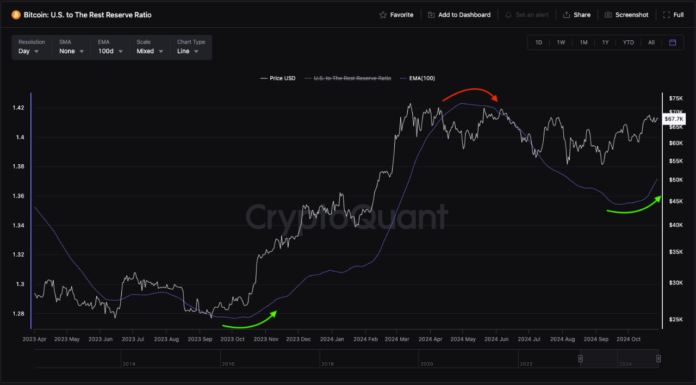
Now, here is a chart that shows the trend in the 100-day Exponential Moving Average (EMA) of the Bitcoin US to The Reserve Ratio over the past year and a half:
As displayed in the above graph, the 100-day EMA Bitcoin US to The Rest Reserve Ratio had been declining earlier in the year, but during the past couple of months, its value has bottomed out and shown a reversal to the upside. This would mean that a transfer of BTC is now occurring from global platforms to the US-based ones. In the chart, the quant has marked the last instance of the indicator displaying this trend.
It would appear that the previous turnaround in the metric had occurred in the last quarter of 2023 and had accompanied a BTC rally that would eventually take the asset to a new all-time high (ATH). The sharpest part of this increase in the indicator had come in the first quarter of 2024. The reason behind this acceleration had been the introduction of the spot exchange-traded funds (ETFs) in the US, which had quickly gained popularity among the investors.
From the graph, it’s also visible, though, that a while after the price had reached the ATH, the metric had topped out and witnessed a reversal in direction. Thus, the spot ETFs couldn’t keep up the same level of interest.
The analyst notes that BTC’s sustained consolidation this year can be traced back to this decrease in the reserve of the US-based platforms. Since the indicator has once again shown a turnaround recently, it’s possible that Bitcoin could see the return of bullish momentum, if the previous pattern is to go by.
BTC Price
Following a 2% jump during the last 24 hours, Bitcoin has returned back to the $68,700 level.
Credit: Source link


 Bitcoin
  Ethereum
  XRP
XRP  Tether
  Solana
  USDC
USDC  Dogecoin
  Cardano
  Lido Staked Ether
  TRON
TRON  Wrapped Bitcoin
  Chainlink
  Sui
Sui  Wrapped stETH
  Avalanche
  Stellar
  Shiba Inu
  Litecoin
  Toncoin
  LEO Token
  Hyperliquid
  Hedera
  USDS
USDS  WETH
WETH  Polkadot
  Bitcoin Cash
  Bitget Token
  Ethena USDe
  Uniswap
  MANTRA
  Wrapped eETH
  Ondo
Ondo  Monero
  Pepe
Pepe  NEAR Protocol
  WhiteBIT Coin
  Aave
Aave  Aptos
Aptos  Dai
Dai  Mantle
  Internet Computer
  Official Trump
  sUSDS
sUSDS  Bittensor
  Ethereum Classic
  OKB
OKB  Gate
Gate  POL (ex-MATIC)
