The overall market sentiment is usually determined by looking at long-term market behavior. However, while zooming out can put current market conditions into a much better perspective, sometimes the most solid gauge of the market’s position lies in the middle.
SOPR and its value in market analysis
The Spent Output Profit Ratio (SOPR) is a handy metric for determining the overall market sentiment. As its name suggests, the metric compares the value of outputs when they were spent to when they were created. The metric shows the degree of realized profit for all coins moved on-chain in a particular time frame.
When SOPR exceeds one, the coins in question are transacting at a profit. When the ratio is less than one, the coins are transacting at a loss. A SOPR ratio of 1 is called a SOPR reset and is often used to signal the start or the end of a mid-term cycle. The SOPR reset can also act as support in bull markets or as resistance in bear markets.
While the metric is an elementary and easy-to-interpret signal, it can be further modified to present a much more complex market view.
For example, filtering transactions to remove any “in-house” activity (e.g., transactions between addresses belonging to the same owner) is done through aSOPR, which shows better market signals when compared to the raw-data SOPR. The SOPR and aSOPR metrics can be further segmented into cohorts of long-term and short-term holders.
Bitcoin’s SOPR
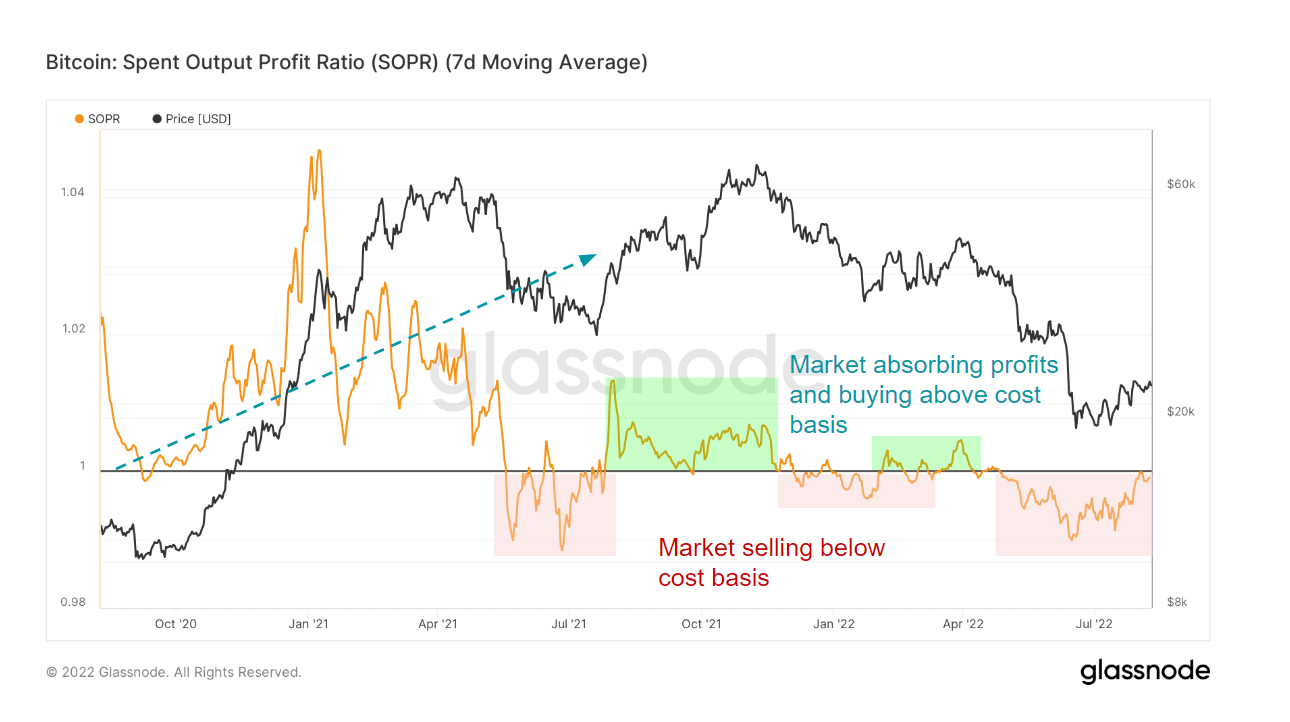
For the first time since May, Bitcoin’s 7-day MA SOPR has been trying to break above 1. At the end of July, Bitcoin’s SOPR touched one and has been retesting it throughout the first week of August.
Every time Bitcoin hit a SOPR of 1 and failed to break resistance; its price saw a brief uptick. Attempts to break the SOPR resistance have almost always correlated with bear market rallies, sometimes referred to as dead cat bounces.
And while Bitcoin’s unsuccessful attempts to break through the resistance might look pessimistic, the outlook is positive. Historically, it has always taken several attempts for SOPR to break above 1. The more it fought to break through the ratio of 1, the stronger the support it had later on.

Ethereum’s SOPR
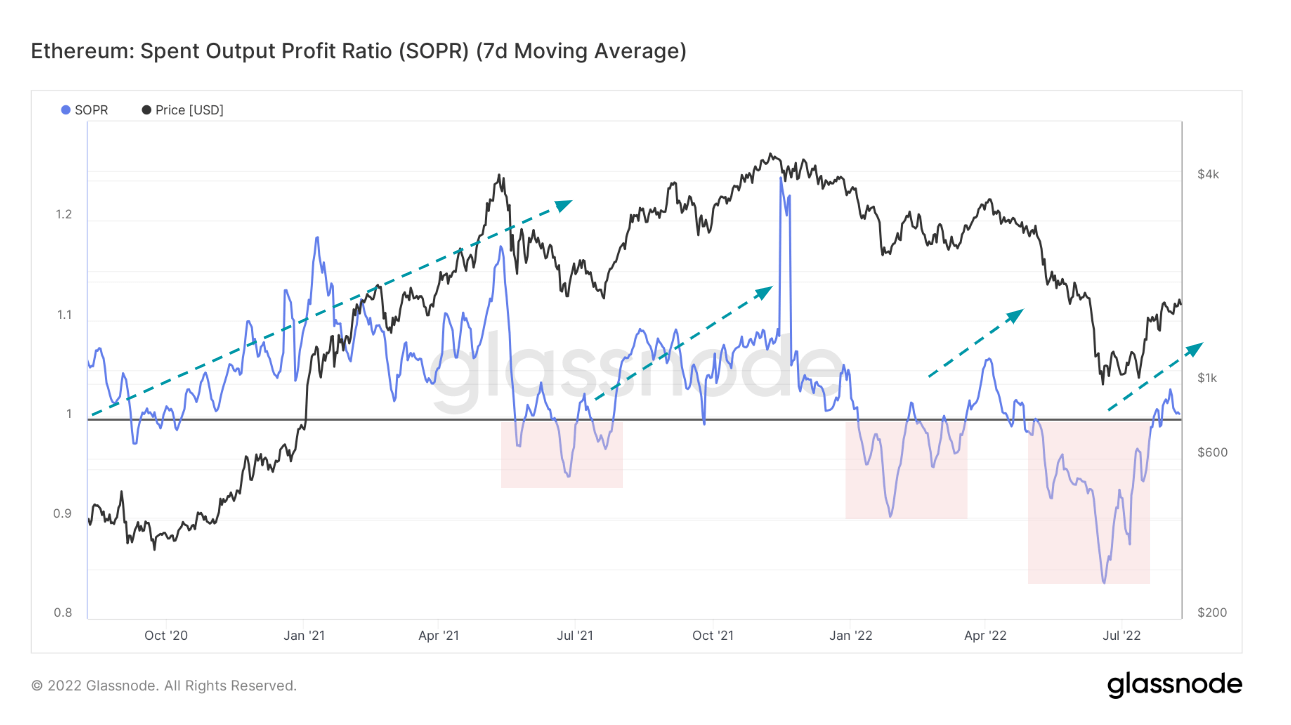
Unlike Bitcoin, Ethereum managed to pierce above the SOPR of 1 at the first attempt. As of August, Ethereum seems to have found support at 1, with data from Glassnode showing it quickly recovered from its last drop. Ethereum’s rising SOPR is a direct result of ETH’s rising price, which has been defying the broader market trend that’s keeping most coins deep in the red.
However, while Bitcoin has been retesting its resistance, Ethereum has been retesting its support, showing the two could be moving in opposite directions. Historically, for the spent output profit ratio to act as strong support, the ratio needed to go through resistance several times for it to act as support.
As previously covered by CryptoSlate, Ethereum’s market-defying rally is largely a result of speculation around the upcoming Merge. This is seen in a significant increase in derivatives trading, which pushed the open interest on Ethereum to $6.4 billion — $1.4 billion more than the open interest on Bitcoin. The rise in derivatives trading stands in contrast with the declining user activity on the network, seen in the dropping gas fees.
This amount of speculation puts the stability of Ethereum’s SOPR in danger. Any weaknesses in Ethereum’s price will certainly affect the ratio and push it below 1. If it were to drop suddenly, Ethereum’s SOPR could find strong resistance if it were to try to break above the level again.

Credit: Source link


 Bitcoin
  Ethereum
  XRP
XRP  Tether
  Solana
  USDC
USDC  Dogecoin
  Cardano
  Lido Staked Ether
  TRON
TRON  Wrapped Bitcoin
  Wrapped stETH
  Chainlink
  Avalanche
  Sui
Sui  Stellar
  Litecoin
  Shiba Inu
  Toncoin
  Hedera
  LEO Token
  USDS
USDS  Hyperliquid
  Polkadot
  WETH
WETH  MANTRA
  Bitcoin Cash
  Ethena USDe
  Bitget Token
  Wrapped eETH
  Uniswap
  Monero
  NEAR Protocol
  Pepe
Pepe  WhiteBIT Coin
  Aave
Aave  Ondo
Ondo  Bittensor
  Aptos
Aptos  Internet Computer
  Dai
Dai  Official Trump
  Ethereum Classic
  Tokenize Xchange
  Mantle
  OKB
OKB  Gate
Gate  sUSDS
sUSDS  Coinbase Wrapped BTC
