Join Our Telegram channel to stay up to date on breaking news coverage
The Solana price prediction requires a swift upward movement, surpassing both the 9-day and 21-day moving averages, to fend off bearish pressure in the market.
Solana Price Statistics Data:
- Solana price now – $100.57
- Solana market cap – $42.9 billion
- Solana circulating supply – 431.9 million
- Solana total supply – 566.7 million
- Solana Coinmarketcap ranking – #5
SOL/USD Market
Key Levels:
Resistance levels: $135.0, $145.0, $155.0
Support levels: $65.0, $55.0, $45.0
SOL/USD is presently trading above the $97.0 mark, indicating potential bullish momentum ahead. This upward movement could resist market selling pressures, positioning Solana (SOL) to surpass the 9-day and 21-day moving averages. Nonetheless, if the bulls cannot maintain the price above $105.0 and the 9-day MA remains below the 21-day MA, traders could witness a shift toward bearish momentum.
Solana Price Prediction: Solana (SOL) May Continue Higher
The Solana price is poised to surpass the 9-day and 21-day moving averages to ascend further, but a bearish trend could prevent this breakout. Should sellers exert downward pressure, a robust support level awaits at $90.0, followed by a subsequent support level at $70.0. However, a deeper bearish momentum could test additional support zones at $65.0, $55.0, and $45.0.
Conversely, should buyers sustain their bullish momentum, the initial resistance level lies at $120.0. A continued upward trajectory could encounter resistance at potential levels of $135.0, $145.0, and $155.0. However, a crossover with the 9-day moving average falling below the 21-day moving average might signal a downward shift in the Solana price.
SOL/BTC Could Face the South
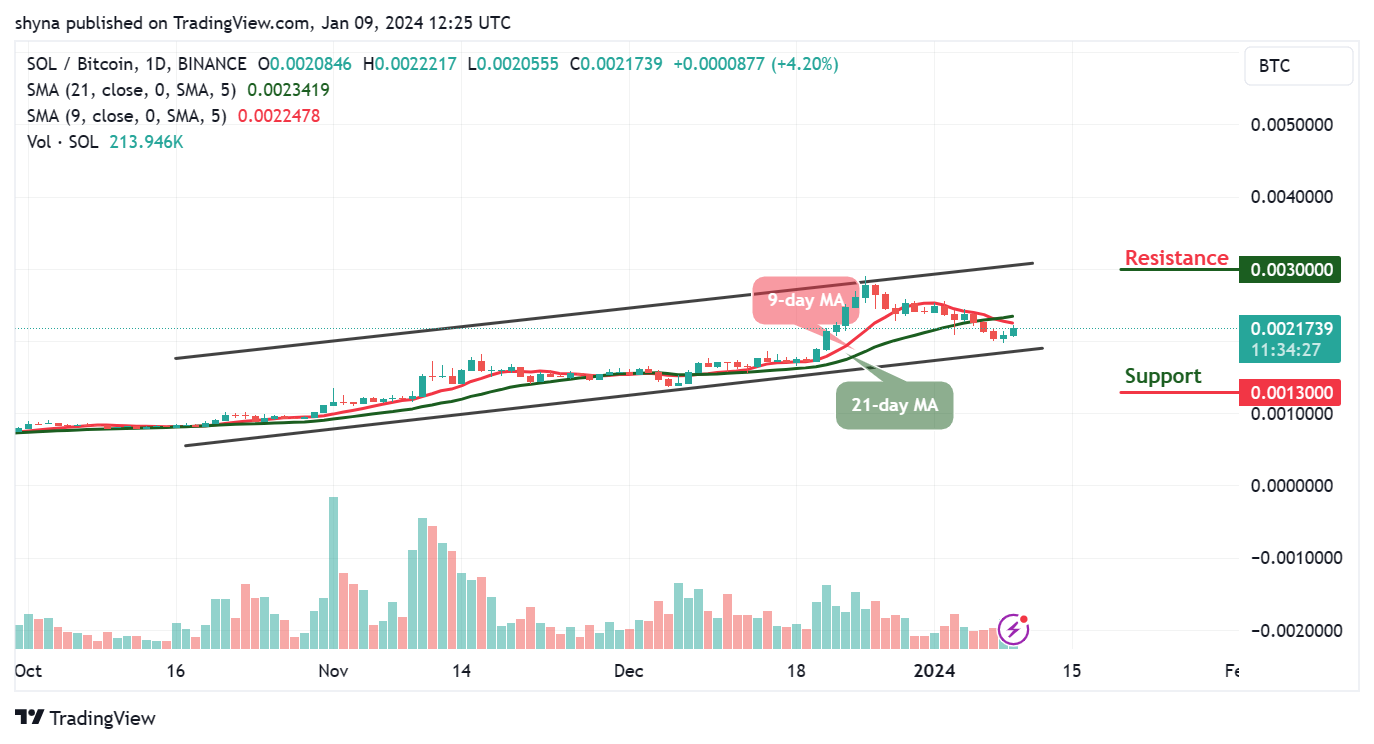
Against Bitcoin, the Solana price is currently trading below the 9-day and 21-day moving averages. However, the pair is valued at 2178 SAT and appears poised to surpass the moving averages. Conversely, should the price drop below the lower boundary of the channel, it might find significant support around the 1300 SAT and below.

Meanwhile, sustained bullish momentum could propel the market towards the upper boundary of the channel. A breakthrough above this threshold could pave the way for the coin to target the resistance level of 3000 SAT and above. However, this upward trajectory is further indicated by a potential bullish crossover, where the 9-day MA is likely to surpass the 21-day MA, signaling the potential for continued bullish activity in the market.
Solana Alternatives
According to the daily chart, the Solana price is moving close to the resistance level of $110 as the coin prepares to create an additional gain. Meanwhile, the bulls may need to increase the pressure as the 9-day moving average could make a bullish cross above the 21-day moving average to suggest a buy signal in the market.
Certainly, investors are strongly recommended to explore the promising opportunities presented by Bitcoin Minetrix, a ground-breaking token that has successfully raised $7.9 million through its initial coin offering. As it rapidly sells out, Bitcoin Minetrix distinguishes itself notably from Solana (SOL), a cryptocurrency ranked 5th with a market capitalization of $42.9 billion. Furthermore, $BTCMTX is emerging as a vibrant and promising player in the dynamic cryptocurrency arena.
New Crypto Mining Platform – Bitcoin Minetrix
- Audited By Coinsult
- Decentralized, Secure Cloud Mining
- Earn Free Bitcoin Daily
- Native Token On Presale Now – BTCMTX
- Staking Rewards – Over 100% APY
Join Our Telegram channel to stay up to date on breaking news coverage
Credit: Source link


 Bitcoin
  Ethereum
  XRP
XRP  Tether
  Solana
  USDC
USDC  Dogecoin
  Cardano
  Lido Staked Ether
  TRON
TRON  Wrapped Bitcoin
  Wrapped stETH
  Chainlink
  Avalanche
  Sui
Sui  Stellar
  Litecoin
  Shiba Inu
  Toncoin
  LEO Token
  Hedera
  USDS
USDS  Hyperliquid
  Polkadot
  WETH
WETH  MANTRA
  Bitcoin Cash
  Bitget Token
  Ethena USDe
  Wrapped eETH
  Uniswap
  Monero
  NEAR Protocol
  Pepe
Pepe  WhiteBIT Coin
  Ondo
Ondo  Aave
Aave  Bittensor
  Aptos
Aptos  Dai
Dai  Internet Computer
  Official Trump
  Mantle
  Ethereum Classic
  Tokenize Xchange
  OKB
OKB  Gate
Gate  sUSDS
sUSDS  Sonic (prev. FTM)