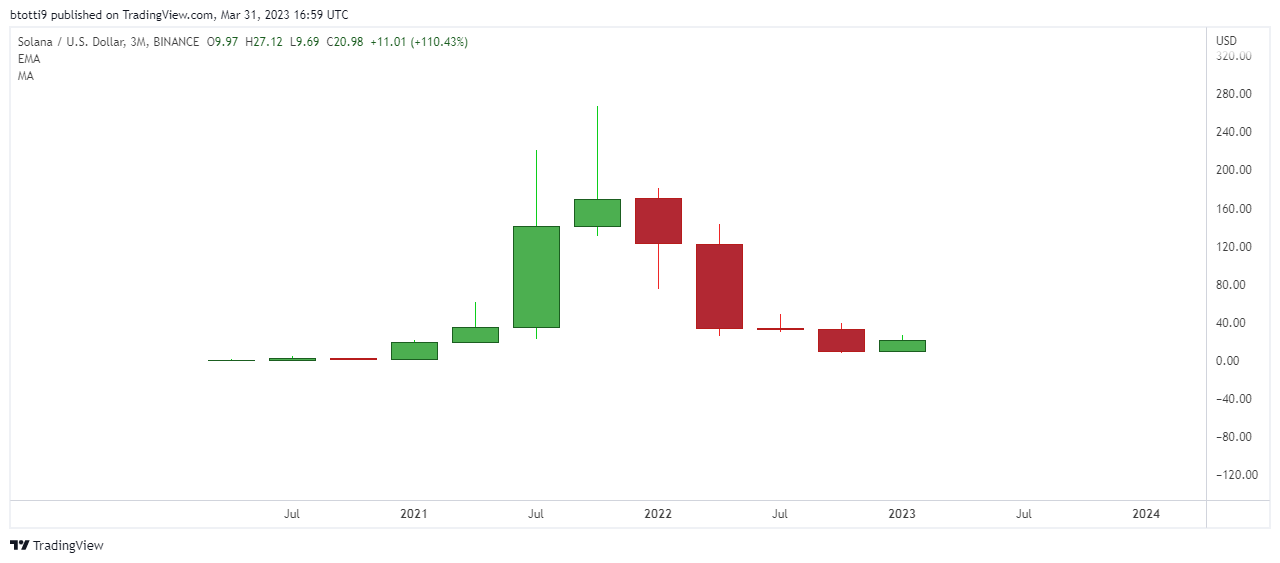
- Solana price is up 110% in the past three months.
- SOL closed in the red in February and is likely to end March 4% lower, but January ended with SOL 140% up.
- Crypto intelligence firm Messari has highlighted Solana’s growth potential as network navigates away from recent outages and other challenges.
Solana price is negative on the monthly time frame in March, with SOL/USD at $20.88 currently seeing the token down 3% in the past 30 days. Notably, Solana price remains 80% down this past year and about 91% off its all-time highs of $260 reached in November 2021.
However, the cryptocurrency is set for its best quarterly returns in nearly two years. This is despite all the downside pressure amid network challenges since late last year, with SOL’s returns over the past three months well over 100%.
Messari highlights Solana growth potential
Crypto market intelligence firm Messari recently highlighted Solana’s growth even as FUD spread, noting that trying to compare the blockchain to some L2s in terms of TVL was missing the point.
“Comparing Solana’s TVL to other emerging chains doesn’t tell the full story. Usage has been driven by non-TVL dominant use cases like derivatives, NFTs, & DePIN networks. If Solana decides to turn on incentives, we could quickly see volume approach parity with the top L2s,” Messari researchers wrote.
3/ Comparing @solana‘s TVL to other emerging chains doesn’t tell the full story.
Usage has been driven by non-TVL dominant use cases like derivatives, NFTs, & DePIN networks.
If Solana decides to turn on incentives, we could quickly see volume approach parity with the top L2s. pic.twitter.com/uwkxuEdZk8
— Messari (@MessariCrypto) March 22, 2023
According to Messari, Solana developers are focused on simplifying the deployment of innovative DeFi strategies, automation of on-chain instructions, and deployment of Web3-native websites among others. The pivot towards these efforts could prove key to the Solana ecosystem, with greater adoption very much likely.
What next for Solana price?
TradingView data shows the 3-month candle for SOL/USD is currently poised at +110%. It’s the best quarterly return since Q2, 2021, when the price of Solana rose almost 300% as bullish momentum catapulted cryptocurrencies higher.
Looking at the monthly chart, Solana returns are highest in January with a monthly close at $23.93 giving it 30-day gains of 140%. The last time SOL/USD posted more gains on the monthly timeframe was in August 2021 when prices jumped 195%.
 Solana price on the 3-month chart. Source: TradingView
February and March were not so profitable for bulls, with prices down 9% in the second month of 2023. A look at the weekly chart for SOL suggests a slight advantage for sellers with the weekly RSI below the 50 line and prices facing an uphill task towards $40.
On the downside, a breakdown below $20 could risk new dump to the 16.
Credit: Source link


 Bitcoin
  Ethereum
  XRP
XRP  Tether
  Solana
  USDC
USDC  Dogecoin
  Cardano
  Lido Staked Ether
  TRON
TRON  Wrapped Bitcoin
  Wrapped stETH
  Chainlink
  Avalanche
  Sui
Sui  Stellar
  Litecoin
  Shiba Inu
  Toncoin
  Hedera
  LEO Token
  USDS
USDS  Hyperliquid
  Polkadot
  WETH
WETH  MANTRA
  Bitcoin Cash
  Ethena USDe
  Bitget Token
  Wrapped eETH
  Uniswap
  Monero
  NEAR Protocol
  Pepe
Pepe  WhiteBIT Coin
  Aave
Aave  Ondo
Ondo  Bittensor
  Aptos
Aptos  Internet Computer
  Dai
Dai  Official Trump
  Ethereum Classic
  Mantle
  Tokenize Xchange
  OKB
OKB  Gate
Gate  sUSDS
sUSDS  Coinbase Wrapped BTC
