Shiba Inu has gone down 10% since hitting a local top two days ago. But here are some metrics that suggest the rally could still continue.
Shiba Inu On-Chain Metrics Have Seen Positive Developments Recently
Shiba Inu had been stuck in a perpetual sideways trend during most of July, but the meme coin’s fate switched in the first few days of this month as its price showed some strong upwards momentum.
In this rally, the asset had managed to breach the $0.00001000 level, meaning that it had risen almost 30% in a matter of days. The coin, however, couldn’t keep this rise up and soon hit a local top, and since then, SHIB has been moving down.
The below chart shows how Shiba Inu has performed during the past month:
Looks like the value of the asset has shot up in recent days | Source: SHIBUSD on TradingView
As you can see in the graph, while SHIB has seen a notable 10% drawdown since the top around two days back, the full gains of the rally haven’t been wiped out just yet.
Shiba Inu is still around 9% up during the past week, which makes it by far the best-performing coin among the top assets by market cap, as most of the sector has in fact gone into the red in this period. Investors of SHIB’s eternal rival, Dogecoin, for instance, are 5% underwater in the past seven days.
When looking at only the last 24 hours, though, the meme coin is the worst-performing top coin, as it has registered losses of around 5%. So it’s possible that Shiba Inu has already lost its steam and the asset would gradually keep declining until all the profits of the rally are retraced.
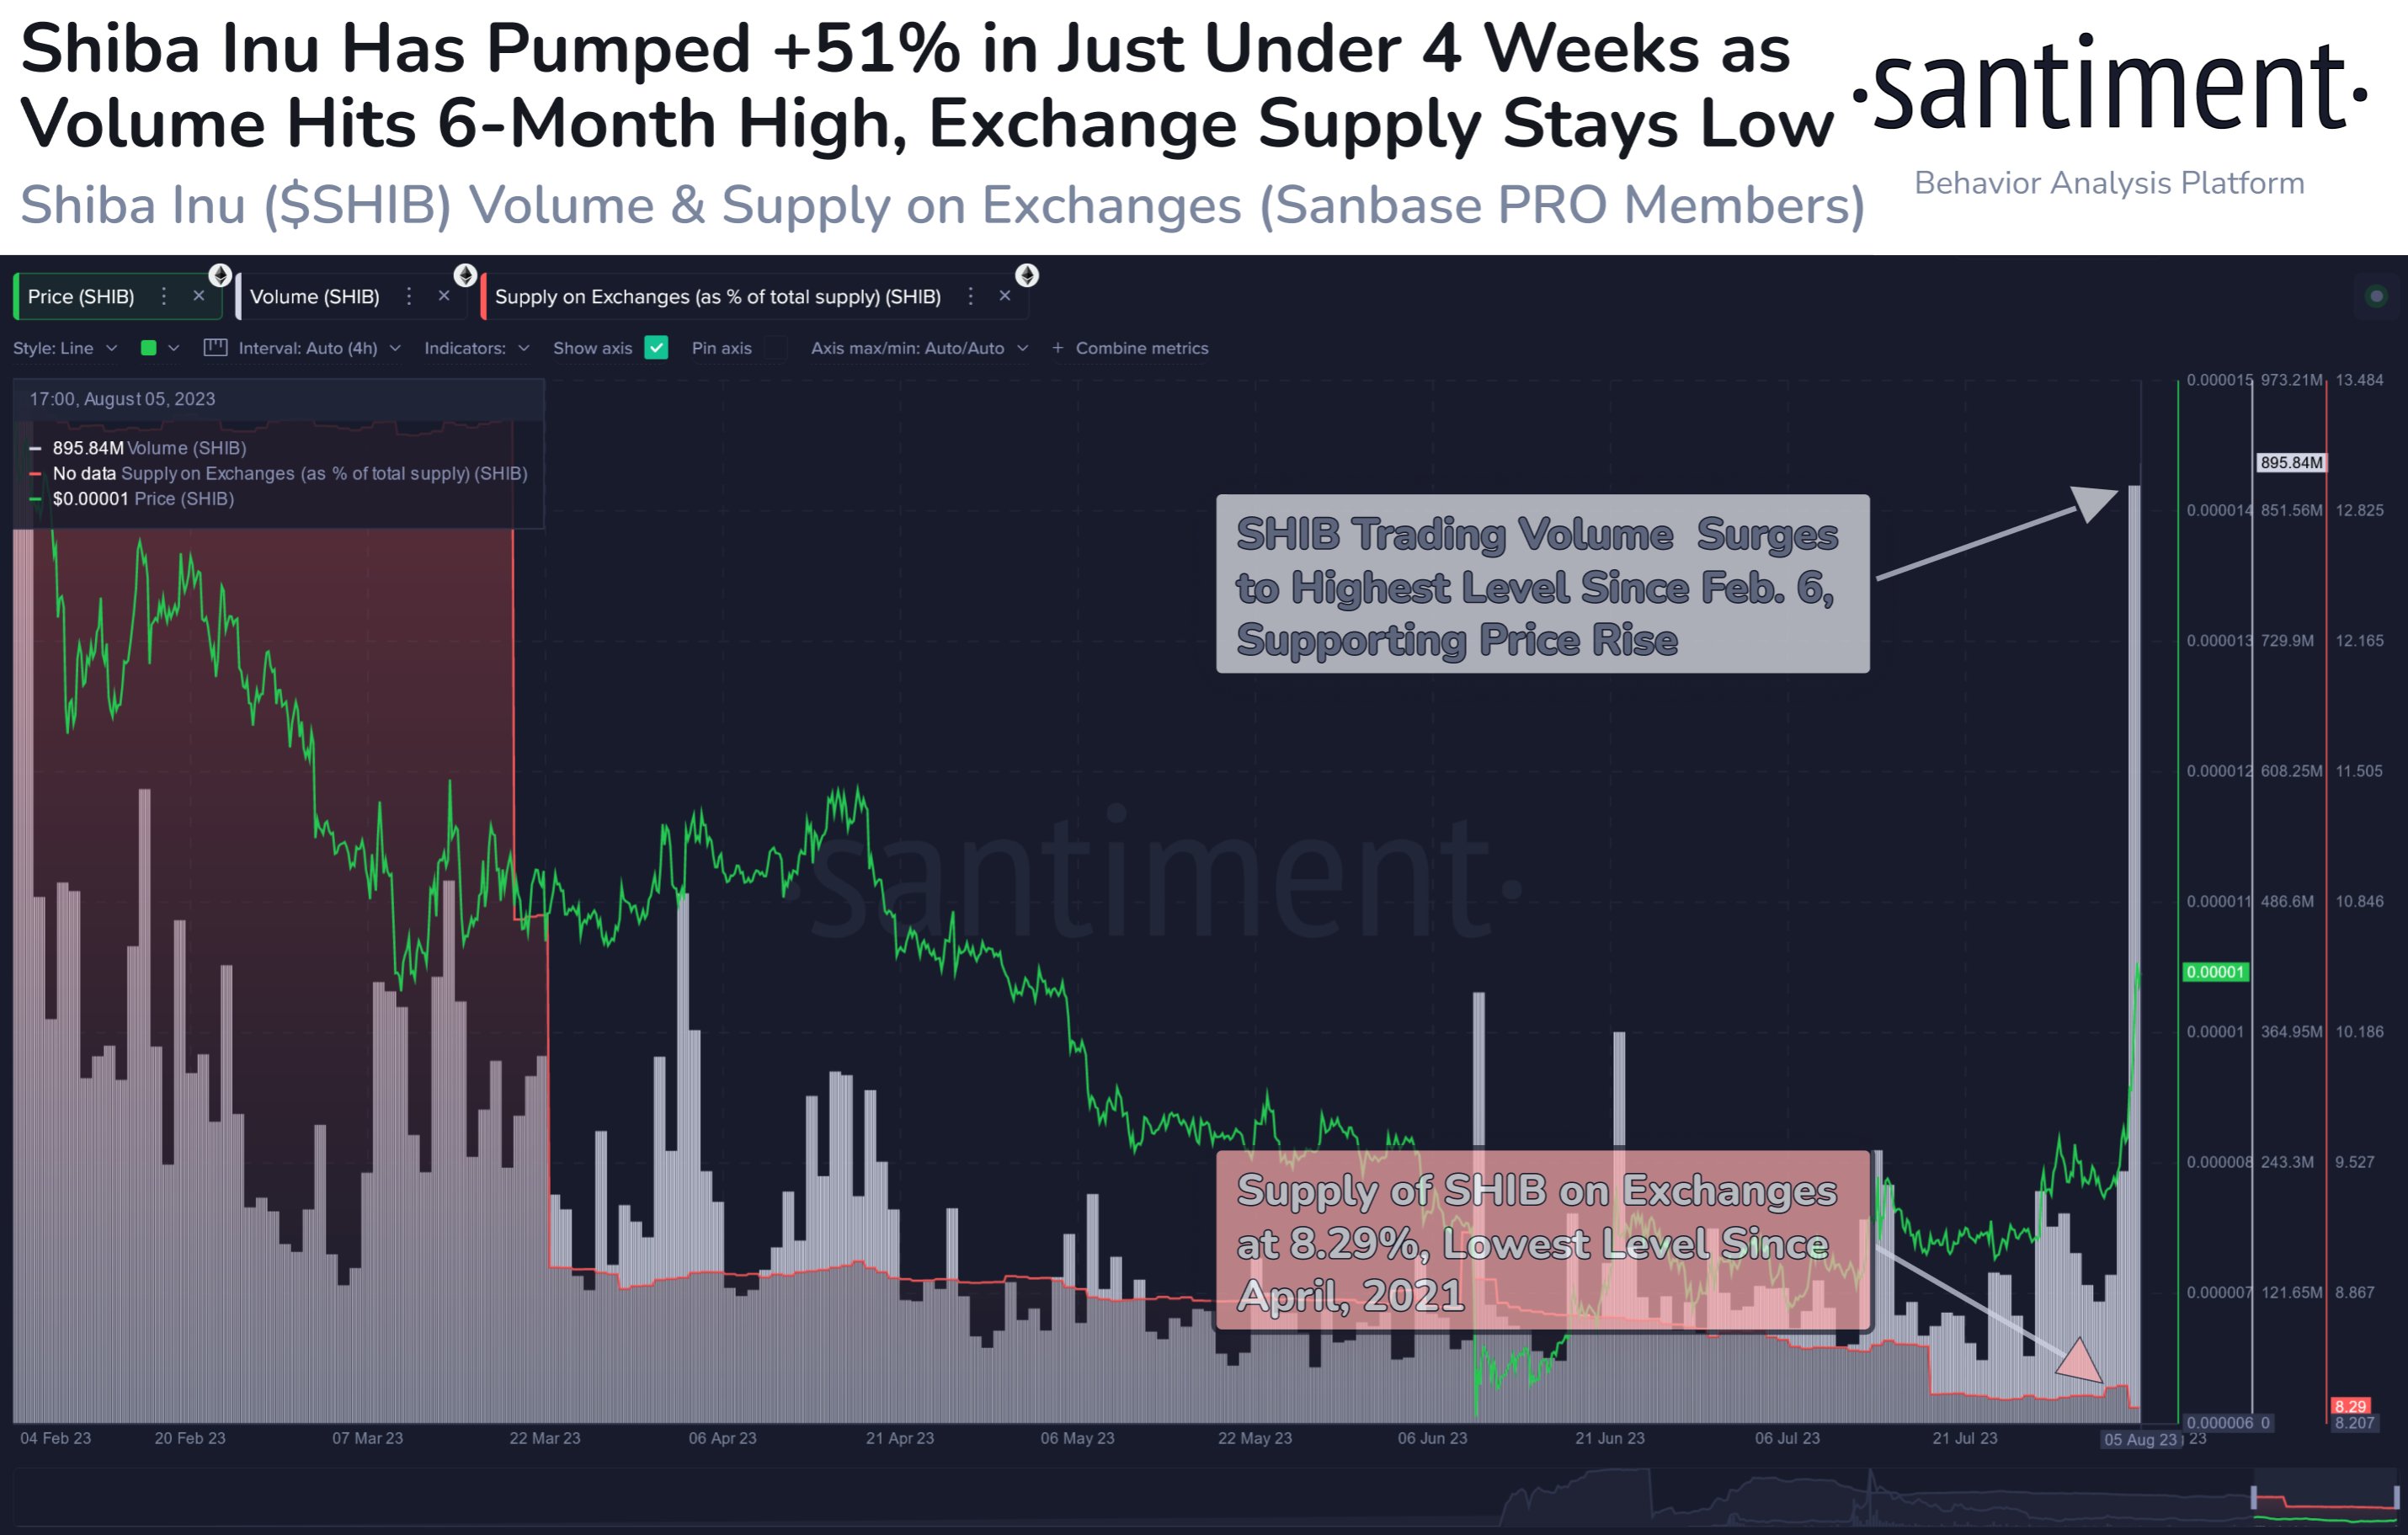
Data from the on-chain analytics firm Santiment, however, might provide a glimmer of hope to the meme coin’s holders, as some positive developments seem to have occured in the coin’s underlying metrics.
The data for the SHIB trading volume and exchange supply | Source: Santiment on X
There are two indicators of interest here: the “trading volume” and the “supply on exchanges.” The former of these is the measure of the total amount of SHIB that investors are transacting on the blockchain right now, while the latter keeps track of the total number of coins sitting in the wallets of all centralized exchanges.
From the chart, it’s visible that the trading volume has shot up for the asset recently. This is a sign that there is a high amount of interest around Shiba Inu right now, which could potentially help fuel more price surges.
The supply of exchanges, on the other hand, has registered a decline at the same time. This is also likely to be constructive for the meme coin, as these platforms are what investors use for selling-related purposes.
Since holders are withdrawing their coins from them (possibly for holding onto the SHIB for extended periods), the selling pressure in the market as a whole may be going down.
It’s far from a guarantee, but if these factors continue to stay favorable in the coming days, then a bounce back for the Shiba Inu rally may become more probable.
Featured image from Ferhat Deniz Fors on Unsplash.com, charts from TradingView.com, Santiment.net
Credit: Source link


 Bitcoin
  Ethereum
  XRP
XRP  Tether
  Solana
  USDC
USDC  Dogecoin
  Cardano
  Lido Staked Ether
  TRON
TRON  Chainlink
  Wrapped Bitcoin
  Avalanche
  Wrapped stETH
  Stellar
  Sui
Sui  Toncoin
  Hedera
  Shiba Inu
  WETH
WETH  LEO Token
  Polkadot
  Litecoin
  Bitget Token
  Bitcoin Cash
  Hyperliquid
  USDS
USDS  Uniswap
  Wrapped eETH
  Ethena USDe
  Pepe
Pepe  MANTRA
  NEAR Protocol
  Aave
Aave  Monero
  Ondo
Ondo  WhiteBIT Coin
  Internet Computer
  Aptos
Aptos  Official Trump
  Mantle
  Ethereum Classic
  Dai
Dai  Cronos
  POL (ex-MATIC)
  Bittensor
  OKB
OKB 
