
Quick Take
According to Glassnode, investors accumulate and store (or lose) coins for extended periods, categorized based on how long it has been since they last moved on-chain.
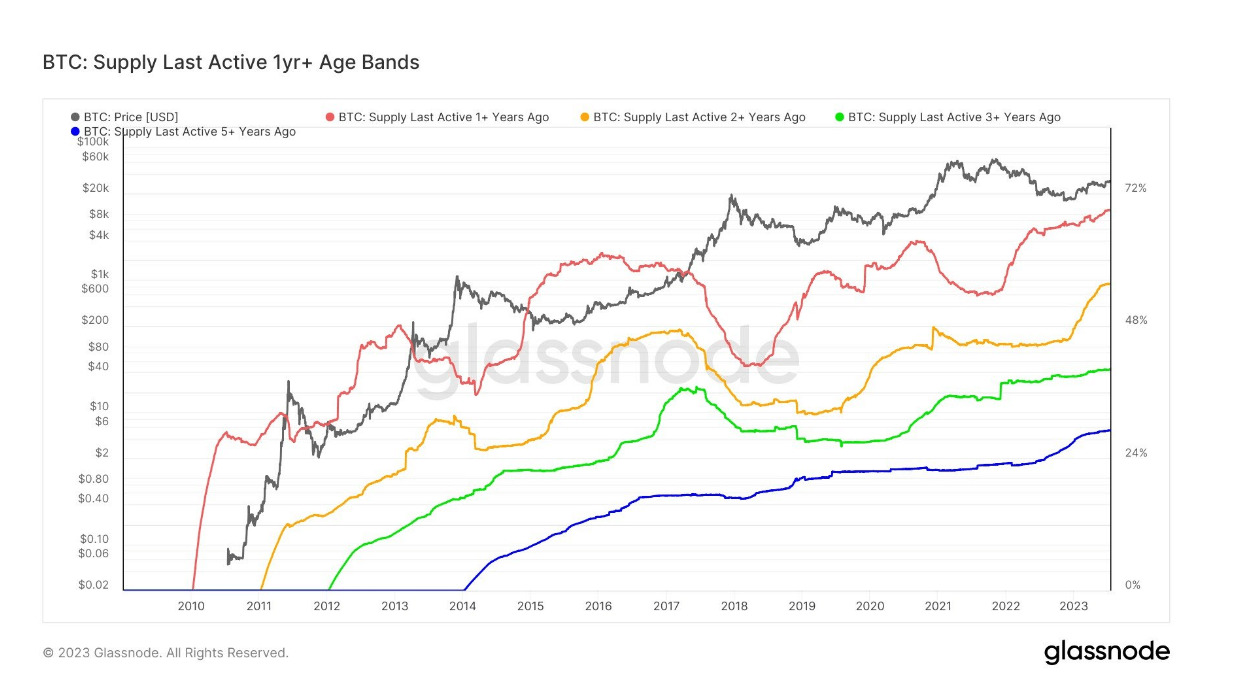
The chart below displays an overlay of multiple Supply Last Active variants, each shown as a percentage of Circulating Supply.
- Supply Last Active 1+ Yrs Ago
- Supply Last Active 2+ Yrs Ago

- Supply Last Active 3+ Yrs Ago

- Supply Last Active 5+ Yrs Ago

Glassnode data suggests that these metrics will rise as longer-term investors accumulate coins. Conversely, as long-term investors spend and distribute their coins, this metric will decline, with older coins becoming young again as they change hands.
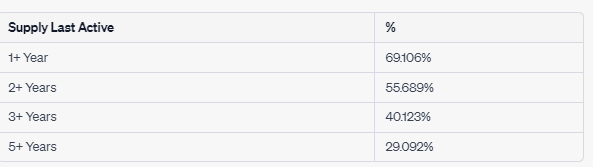
Data shows that we have hit an all-time high in every category once again for Bitcoin supply last active.
- 1+ Year = 69.106%
- 2+ Years = 55.689%
- 3+ years= 40.123%
- 5+ years= 29.092%
The post Record-breaking peaks reached in all categories of Bitcoin supply appeared first on CryptoSlate.
Credit: Source link


 Using Ledger and MetaMask")
 Bitcoin
  Ethereum
  XRP
XRP  Tether
  BNB
BNB  Solana
  USDC
USDC  Dogecoin
  Cardano
  Wrapped Bitcoin
  Wrapped stETH
  Avalanche
  Sui
Sui  Stellar
  Litecoin
  Toncoin
  Shiba Inu
  Hedera
  LEO Token
  USDS
USDS  Hyperliquid
  Polkadot
  WETH
WETH  MANTRA
  Bitcoin Cash
  Ethena USDe
  Wrapped eETH
  NEAR Protocol
  Pepe
Pepe  WhiteBIT Coin
  Bittensor
  Ondo
Ondo  Aave
Aave  Aptos
Aptos  Official Trump
  OKB
OKB  Gate
Gate  sUSDS
sUSDS 
