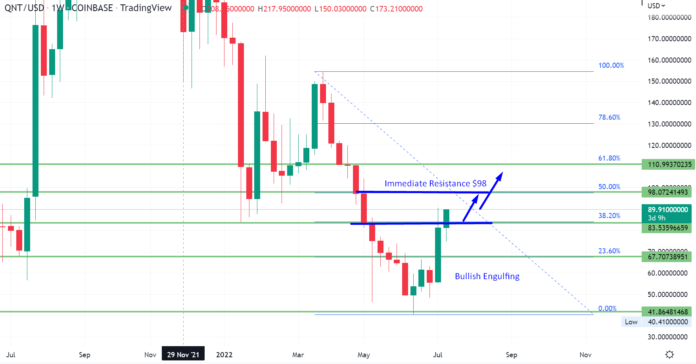
On Thursday, the altcoin Quant (QNT) is trading near recent highs as prices battled through a volatile session. Despite falling by as much as 16% during the weekend, QNT recovered to trade near a two-month high of $90.
During the early European session, the QNT token fell to an intraday low of $82.60 as prices remained above the major support level of $77. Prices have risen slightly since then, with the token now trading above $85, about $3.5 below last week’s high.
This peak at $90.35 was the highest price for QNT/USD since June 9; after this high, selling sentiment returned as investors likely liquidated their previous positions.
Buy Quant Now
Your capital is at risk.
QNT is the native cryptocurrency of the Quant Network, a blockchain platform that enables blockchain interoperability. Recent gains in Quant (QNT) have come as the 15-day moving average has continued to rise against the 20-day MA, but this momentum has been halted by the recent price ceiling of $89.35.
Even though sellers have donated to a volatile trading week, momentum continues to be somewhat bullish, which may amplify during the upcoming trading sessions. Quant (QNT) broke free from a seven-month-old falling wedge formation on Saturday. Whereas the closing of bullish candles above the double top resistance becomes a support level of $77 is likely to keep the bullish trend in place.
Quant (QNT) has ascended significantly in the previous week, implying that a bottom is close at hand. However, the rate quickened as buyers drove the price above $67.
Speaking about the lagging technical indicators, the moving averages have formed a bullish confluence, and the relative strength index is positive, signifying a potential trend reversal.
Quant (QNT) Barrels Break Through the $75 Mark
After nearly two months, a tremendous price gain pushed QNT above the $67 mark. As QNT bulls pushed forward, the coin’s price increased, breaking through the $75 resistance level. As previously stated, this level posed a significant challenge for QNT and was extended by the double top pattern.
However, the price crossing over the $75-77 resistance level and closing above suggests that the bullish trend will likely continue. Therefore, traders might look for buying trades above this level.
If the upward momentum resumes this week, the following essential price levels to watch are $89 and $110. These particular levels are being extended by the 50% and 61.8% Fibonacci retracement points.
Meanwhile, volumes have increased in recent sessions, resulting in boosted volatility; hence, traders should wait until the price settles before entering into transactions.
What’s there for Sellers?
Looking at the daily timeframe, the uptrend of QNT/USDT is running into a stumbling block near $90. Since the QNT/USDT coin is struggling under $90, failing to break through will likely drive bearish correction. On the lower side, the QNT price may find support near $84 and $80.
Given its bullish power and technical outlook, the QNT is unlikely to reverse its current uptrend. As a result, you may be able to profit from a further buying trend above the 38.2 % Fibonacci retracement level of $83.25. Finally, the formation of an inside bar up candlestick pattern on the daily timeframe adds to the bullish trend. Consider purchasing over $83 with a target of $98. Good luck!
Read More:
Battle Infinity – New Crypto Presale
- Presale Until October 2022 – 16500 BNB Hard Cap
- First Fantasy Sports Metaverse Game
- Play to Earn Utility – IBAT Token
- Powered By Unreal Engine
- CoinSniper Verified, Solid Proof Audited
- Roadmap & Whitepaper at battleinfinity.io
Credit: Source link


 Bitcoin
  Ethereum
  XRP
XRP  Tether
  Solana
  USDC
USDC  Dogecoin
  Cardano
  Lido Staked Ether
  TRON
TRON  Wrapped Bitcoin
  Chainlink
  Wrapped stETH
  Avalanche
  Sui
Sui  Stellar
  Litecoin
  Hedera
  LEO Token
  Shiba Inu
  Toncoin
  Hyperliquid
  USDS
USDS  Polkadot
  WETH
WETH  MANTRA
  Bitcoin Cash
  Ethena USDe
  Bitget Token
  Wrapped eETH
  Uniswap
  Monero
  NEAR Protocol
  WhiteBIT Coin
  Pepe
Pepe  Bittensor
  Aave
Aave  Ondo
Ondo  Aptos
Aptos  Dai
Dai  Internet Computer
  Official Trump
  Ethereum Classic
  Mantle
  Tokenize Xchange
  OKB
OKB  Gate
Gate  sUSDS
sUSDS  Sonic (prev. FTM)
