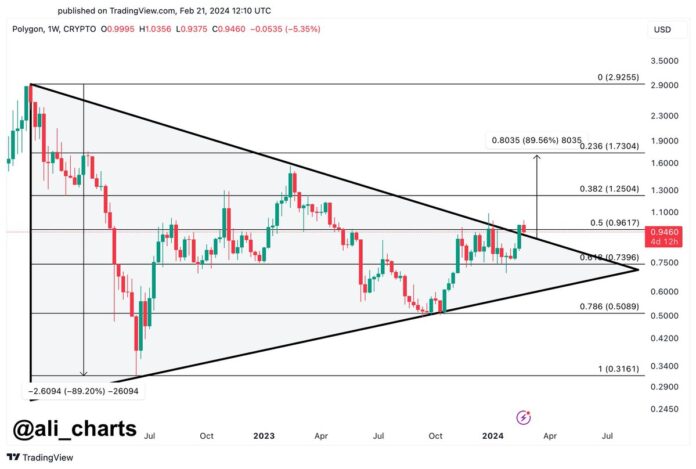
An analyst explained that Polygon could see a potential bull rally to $1.73 if the cryptocurrency’s price is above this level.
Polygon Appears To Be Breaking Out Of A Symmetrical Triangle Currently
In a new post on X, analyst Ali talked about a multi-year Symmetrical Triangle that Polygon has been traveling inside. The “Symmetrical Triangle” is a pattern in technical analysis (TA) that, as its name already implies, looks like a triangle.
The pattern comprises two converging trendlines, with the upper line being made by joining lower highs in the price, while the lower level connects higher lows.
A feature of this pattern is that these two lines approach each other at roughly an equal (but opposite) slope. This is the reason why there is “symmetrical” in its name.
When the price trades inside the triangle, it tends to encounter resistance at the upper level. As such, tops can probably form at the line. Similarly, the lower line can act as a source of support, thus facilitating likely bottoms to take place.
If the asset breaks through either of these barriers, its price could probably see a sustained push in that direction. This means that breaks above the triangle can be bullish signals, while drops under it can signify that a bearish trajectory has taken over.
There are also other triangle patterns in TA, with two popular ones being the Ascending and Descending Triangles. These two patterns differ from the Symmetrical Triangle in that one of their trendlines is parallel to the time axis (meaning their lines can never have an equal slope).
Now, here is the chart shared by Ali that shows a Symmetrical Triangle pattern that the weekly price of Polygon has traded inside for the last couple of years:
Looks like the asset's price has been breaking out of this pattern recently | Source: @ali_charts on X
As the graph shows, the Polygon weekly price has shown signs of a breakout from this Symmetrical Triangle pattern that it has been stuck inside for multiple years.
Since such breakouts have historically been bullish, this surge for MATIC could mean some sustained bullish momentum may be coming. This is only, of course, if the break truly gets confirmed.
“If MATIC can maintain a close above $0.96, it could signal the start of a bull rally, with a potential target of $1.73!” explains the analyst. From the current asset price, a run to this target would mean an increase of more than 78% for the cryptocurrency.
MATIC Price
After witnessing a break above the $1 mark, Polygon slipped yesterday as its price declined to $0.90. However, the coin has recovered above $0.97 in the past day.
This is above the $0.96 target set by the analyst, so if Polygon can continue to maintain above it now, the break might get confirmed for the asset.
The value of the asset appears to have surged over the past week | Source: MATICUSD on TradingView
Featured image from Shutterstock.com, charts from TradingView.com
Disclaimer: The article is provided for educational purposes only. It does not represent the opinions of NewsBTC on whether to buy, sell or hold any investments and naturally investing carries risks. You are advised to conduct your own research before making any investment decisions. Use information provided on this website entirely at your own risk.
Credit: Source link


 Bitcoin
  Ethereum
  XRP
XRP  Tether
  Solana
  USDC
USDC  Dogecoin
  Cardano
  Lido Staked Ether
  TRON
TRON  Wrapped Bitcoin
  Wrapped stETH
  Chainlink
  Avalanche
  Sui
Sui  Stellar
  Litecoin
  Toncoin
  Shiba Inu
  Hedera
  LEO Token
  USDS
USDS  Hyperliquid
  Polkadot
  WETH
WETH  MANTRA
  Bitcoin Cash
  Bitget Token
  Ethena USDe
  Wrapped eETH
  Uniswap
  Monero
  NEAR Protocol
  Pepe
Pepe  WhiteBIT Coin
  Bittensor
  Ondo
Ondo  Aave
Aave  Aptos
Aptos  Internet Computer
  Dai
Dai  Official Trump
  Mantle
  Ethereum Classic
  Tokenize Xchange
  OKB
OKB  Gate
Gate  sUSDS
sUSDS  Sonic (prev. FTM)
