Join Our Telegram channel to stay up to date on breaking news coverage
The Neo price prediction is dropping below the 9-day and 21-day moving averages after touching the daily high at $6.71.
Neo Price Statistics Data:
- Neo price now – $6.62
- Neo market cap – $467.1 million
- Neo circulating supply – 70.5 million
- Neo total supply – 100 Million
- Neo Coinmarketcap ranking – #71
NEO/USD Market
Key Levels:
Resistance levels: $9.0, $10.0, $11.0
Support levels: $5.0, $4.0, $3.0
After touching the resistance level of $6.71 today, NEO/USD is trading at $6.62. The coin is also moving within the channel and below the 9-day and 21-day moving averages, indicating a bearish movement in the market. For the time being, the market price is moving towards the lower boundary of the channel as the trading volume is issuing a sell signal, while the technical indicator confirms the bearish movement.
Neo Price Prediction: NEO Price May Not Be Ready for Higher Levels
At the time of writing, the Neo price is sliding below the moving averages as bulls couldn’t keep the coin on the upside. However, any attempt by the buyers to cancel the current bearish movement and push the Neo price back above the 9-day and 21-day moving averages could revisit the resistance level of $6.71.
Furthermore, any bullish cross above the upper boundary of the channel could lead the market to the crucial resistance levels at $9.0, $10.0, and $11.0. Meanwhile, if the coin continues to head towards the lower boundary of the channel, the NEO price could reach the critical supports at $5.0, $4.0, and $3.0 as the technical indicator Relative Strength Index (14) moves to cross below the 40-level.
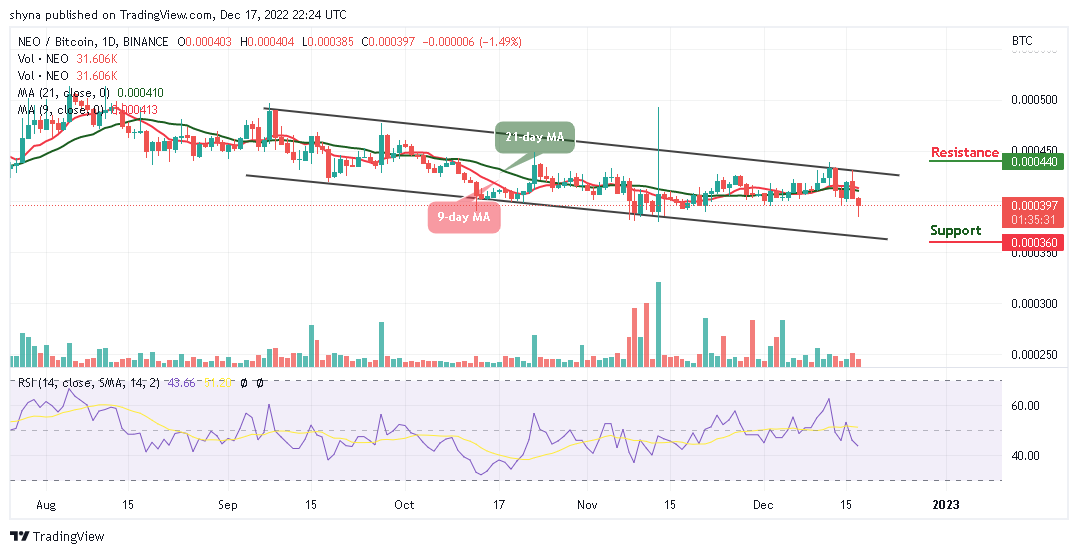
Against Bitcoin, the Neo is trading below the 9-day and 21-day moving averages with a bearish candle heading toward the lower boundary of the channel. The technical indicator Relative Strength Index (14) is moving to cross below the $ 40 level which could bring more bearish signals into the market. Any further drop may likely hit the support level of 360 SAT and below.

Nevertheless, any form of a rebound from the current level at 397 SAT could push the coin to the resistance level of 440 SAT and above. But buyers may need to gather enough momentum to push the market price to the north. For now, NEO/BTC is moving bearishly and may start rising once the technical indicator turns upward.
Dash 2 Trade gives you the ability to optimize your trading and speculative profitability with effective crypto trading recommendations, auto trading, and analytics features. There is a D2T token presale ongoing and time is running out. The presale dashboard launch is coming soon since the product dev is ahead of the schedule. So far, the presale has raised almost $11 million.
Related
Dash 2 Trade – High Potential Presale
- Active Presale Live Now – dash2trade.com
- Featured in Cointelegraph – $10M Raised
- KYC Verified & Audited
- Native Token of Crypto Signals Ecosystem
Join Our Telegram channel to stay up to date on breaking news coverage
Credit: Source link


 Bitcoin
  Ethereum
  XRP
XRP  Tether
  Solana
  USDC
USDC  Dogecoin
  Cardano
  Lido Staked Ether
  TRON
TRON  Wrapped Bitcoin
  Wrapped stETH
  Chainlink
  Avalanche
  Sui
Sui  Stellar
  Litecoin
  Toncoin
  Shiba Inu
  Hedera
  LEO Token
  USDS
USDS  Hyperliquid
  Polkadot
  WETH
WETH  MANTRA
  Bitcoin Cash
  Bitget Token
  Ethena USDe
  Wrapped eETH
  Uniswap
  Monero
  NEAR Protocol
  Pepe
Pepe  WhiteBIT Coin
  Aave
Aave  Bittensor
  Ondo
Ondo  Aptos
Aptos  Internet Computer
  Dai
Dai  Official Trump
  Ethereum Classic
  Mantle
  Tokenize Xchange
  OKB
OKB  Gate
Gate  sUSDS
sUSDS  Coinbase Wrapped BTC
