When markets turn red and inflation starts soaring, both regulators and consumers turn to CPI as a gauge for the damage done by soaring prices but in the chaos that ensues as markets enter into a recession, one metric always seems to be overlooked — the M2 money supply.
The M2 is a measure of the money supply in an economy that includes cash and checking deposits, savings deposits, money market securities, and various other time deposits. The assets included in M2 are less liquid than M1, which includes just cash and checking deposits, but are usually liquid and can be quickly converted to cash.
Central banks use M2 to shape monetary policy when inflation arises, making it one of the most important metrics when economies start to slow down.
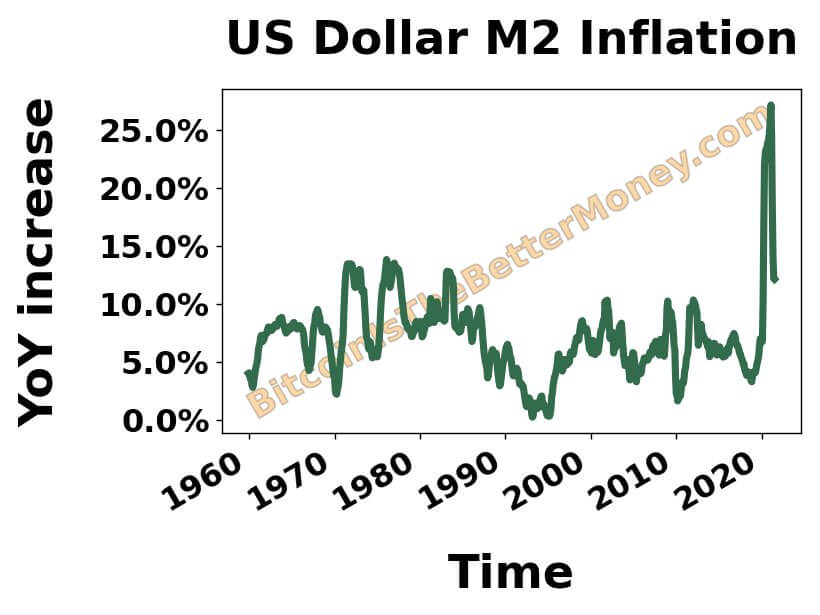
Looking at the data from the U.S. Federal Reserve shows that M2 has been growing exponentially since 1980. Every time the Federal Reserve attempted to reduce its balance sheet recession ensued. Periods of recession have historically sped up the growth of M2, as the Fed’s quantitative easing approach increased the supply of money in the economy.
This is evident in the Fed’s data — gray areas on the graph below indicate periods of recession and show the increase in M2.

Many economists believe that M2 is a much better gauge for inflation than CPI. The coveted consumer price index tracks the average increase across a basket of consumer products and is used to estimate the average increase in prices consumers experience.
However, CPI presents average increases and has a tendency to show a much lower price increase than consumers actually experience.
The latest numbers put the CPI increase at around 8%. However, consumers have felt a price increase that far exceeds 8%. Looking at the increase in M2 paints a much more realistic picture of price increases.
The year-over-year increase in M2 currently stands at above 25% and feels more in line with what consumers experience.

The growing M2 money supply isn’t only a gauge for inflation — it’s also a solid indicator of Bitcoin’s performance.
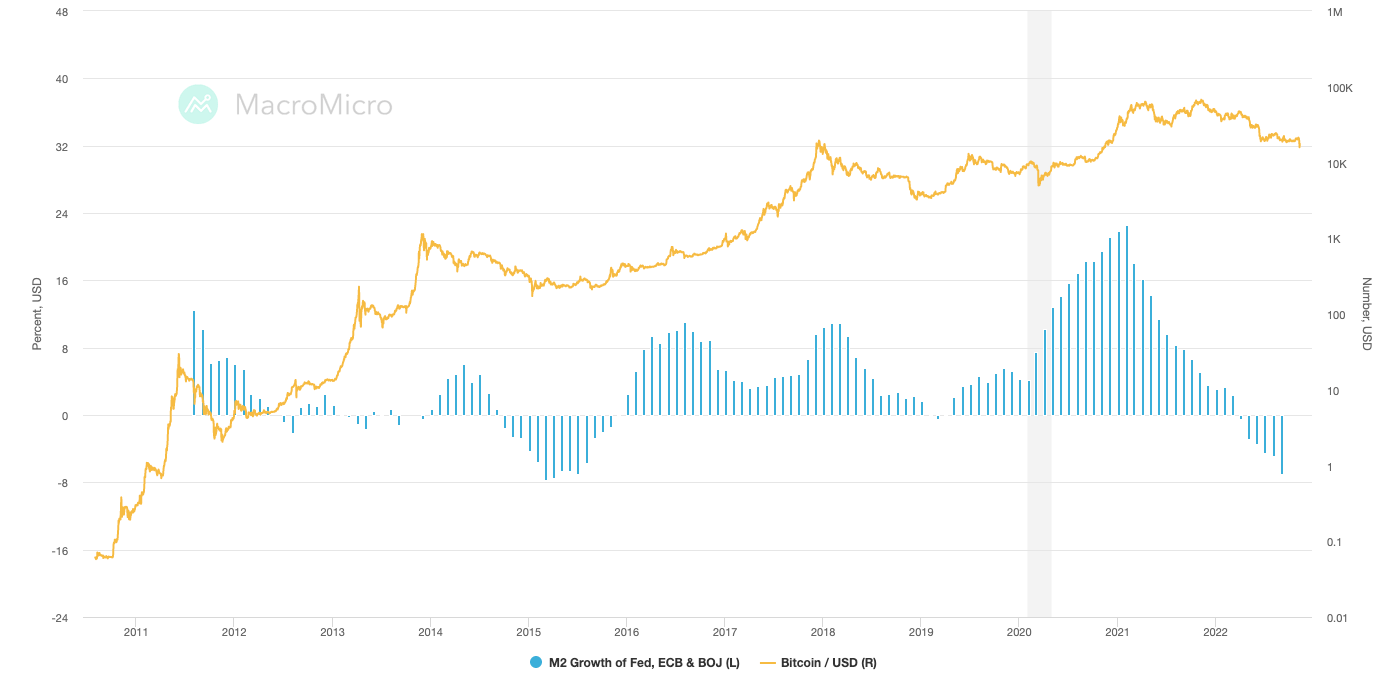
The global M2 plays a key role in Bitcoin’s price movements — when it shrinks, Bitcoin’s price drops. When the M2 grows, Bitcoin’s price grows as well.
Looking at the data for the Federal Reserve, the European Central Bank (ECB), and the Bank of Japan (BOJ) shows the correlation between M2 and Bitcoin’s performance. Every time the global M2 grew Bitcoin’s price saw a parabolic run that triggered a bull market. Every time it decreased, Bitcoin experienced a slump that led to a bear market.
In 2015, 2019, and 2022 the Federal Reserve embarked on an aggressive quantitative tightening spree. Each of those years Bitcoin’s price hit a bottom.

It’s still too early to predict how Bitcoin will react in this cycle of quantitative tightening. The current M2 money supply in the U.S. stands at around $21.5 trillion and is continuing to slightly decrease since peaking at $21.7 trillion in March this year.
The dropping M2 correlates with Bitcoin’s price slump. If it continues the downward trend Bitcoin’s price could fail to recover and regain its yearly high. However, for the current credit-based economy in the U.S. to remain a credit-based economy, the supply of U.S. dollars must continue to rise. In the long run, the endless cycle of printing money could be good for Bitcoin.
Credit: Source link


 Bitcoin
  Ethereum
  XRP
XRP  Tether
  Solana
  USDC
USDC  Dogecoin
  Cardano
  Lido Staked Ether
  TRON
TRON  Wrapped Bitcoin
  Chainlink
  Wrapped stETH
  Avalanche
  Sui
Sui  Stellar
  Litecoin
  Toncoin
  Shiba Inu
  Hedera
  LEO Token
  USDS
USDS  Hyperliquid
  Polkadot
  WETH
WETH  MANTRA
  Bitcoin Cash
  Bitget Token
  Ethena USDe
  Wrapped eETH
  Uniswap
  Monero
  NEAR Protocol
  Pepe
Pepe  WhiteBIT Coin
  Ondo
Ondo  Aave
Aave  Bittensor
  Aptos
Aptos  Dai
Dai  Internet Computer
  Official Trump
  Mantle
  Ethereum Classic
  OKB
OKB  Tokenize Xchange
  Gate
Gate  sUSDS
sUSDS  Coinbase Wrapped BTC
