The Jasmy Coin price rose on Monday, continuing a bullish trend that started in December when it dropped to a low of $0.0028. It jumped to a high of $0.0074, the highest point since September 18. It has jumped by over 152% from its lowest point in December, as we wrote here.
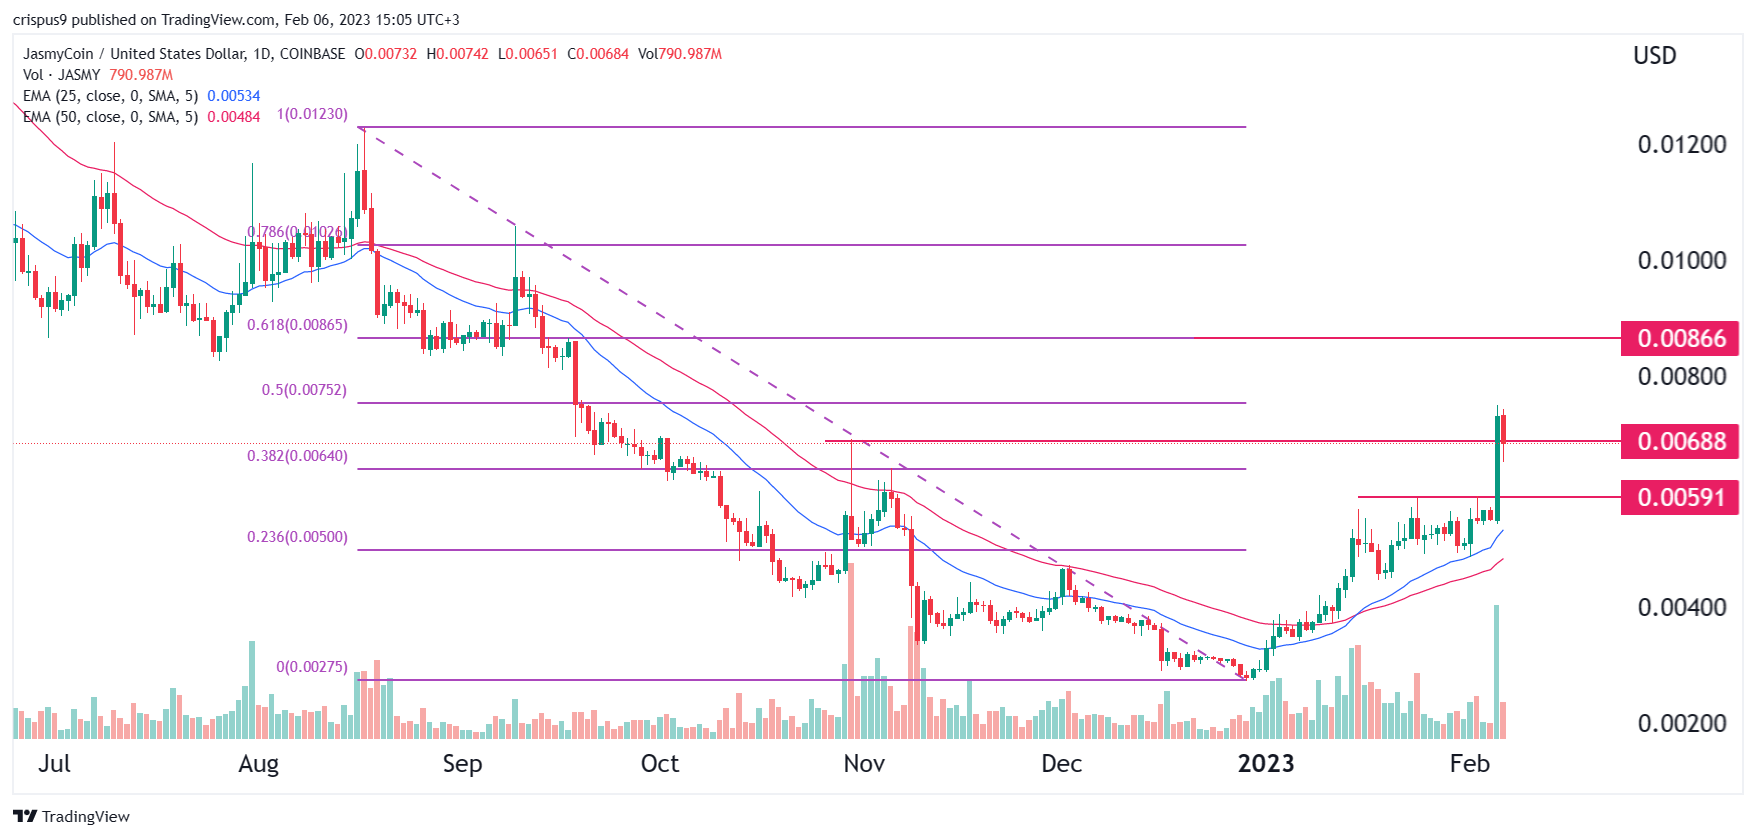
JASMY/USD daily chart analysis
The daily chart shows that the JASMY coin price has been in a strong bullish trend in the past few weeks. This recovery has been accompanied by elevated volume levels. At the same time, the coin has managed to move above the important resistance level at $0.0060, the highest point on January 24.
Jasmy also jumped to the 50% Fibonacci Retracement level. Also, it jumped above the crucial resistance point at $0.0068 (October 30 high). It has also jumped above the 50-day moving average and the Ichimoku cloud indicator. Jasmy, which is known as Japan’s Bitcoin, has also formed an inverted head and shoulders pattern, which is a bullish sign.
Therefore, it seems like Jasmy has the momentum it needs to continue rising in the coming days. If this happens, the next key resistance level to watch will be at $0.0086, the 61.8% Fibonacci Retracement point. This price is about 27% above the current level.
On the flip side, a drop below the important support level at $0.0060 will invalidate the bullish view. If this happens, it will signal that there are still sellers left in the market who will be keen to push it to the next key support level at $0.0050.

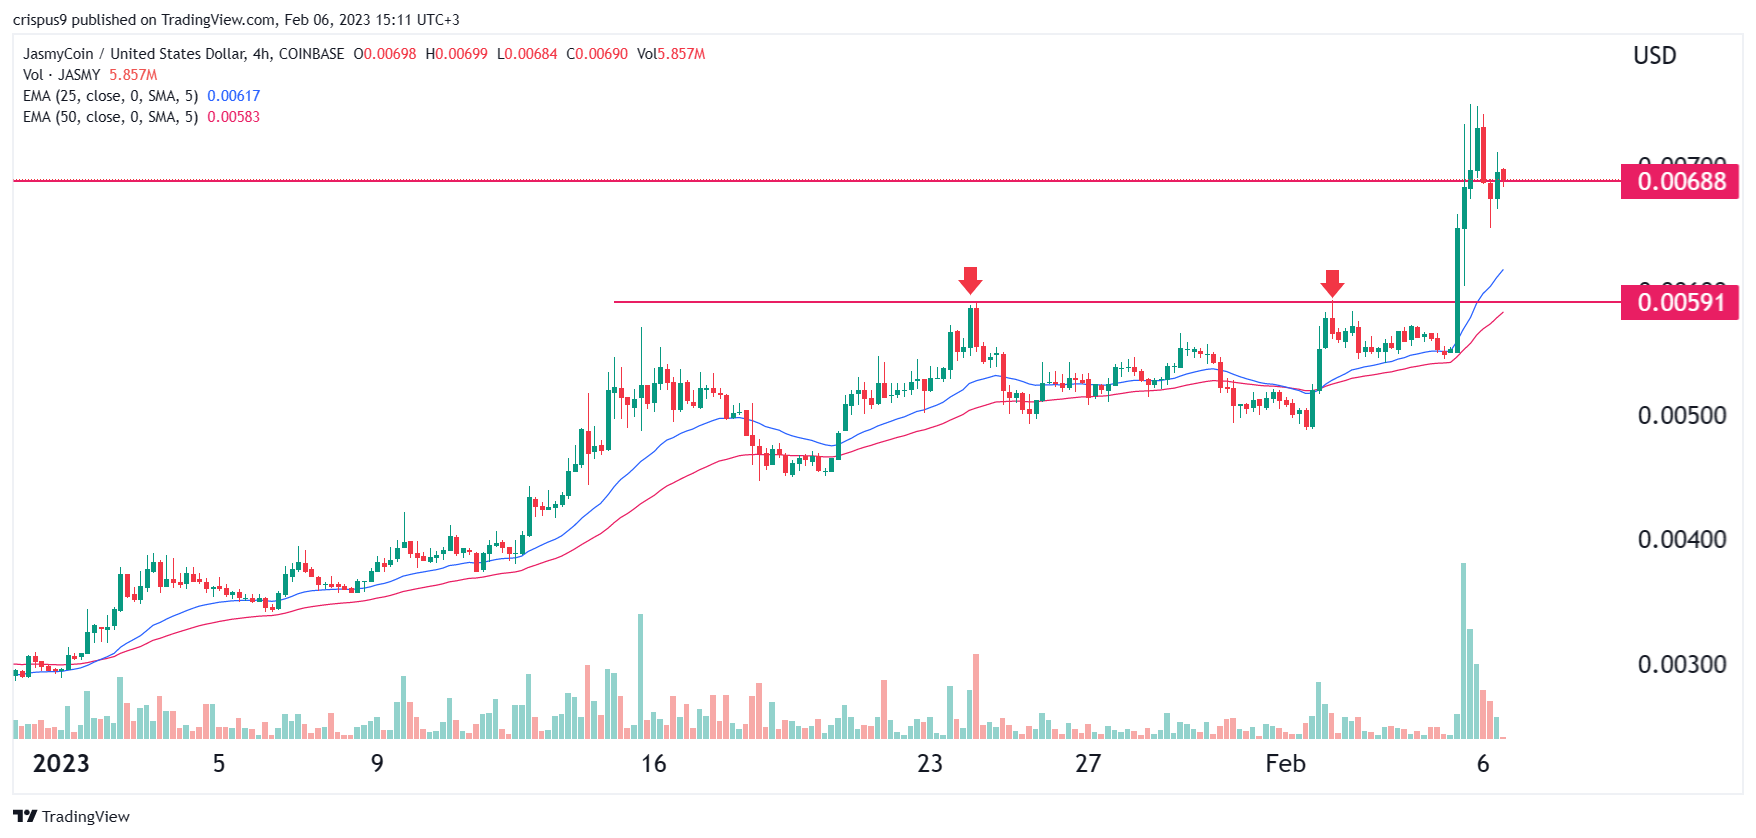
Jasmy price 4H chart analysis
On the 4H chart, we see that the Jasmy Coin price has made a spectacular comeback in the past feww weeks. As it rose, the token crossed the key resistance level at $0.0060, where it struggled to move above on January 24 and February 2. The coin is also above the 25-day and 50-day EMAs.
At the same time, a closer look shows that volume bars have started to drop. Therefore, this could be a sign that the bullish trend is fading, which could see it retreat in the coming days. But on a positive side, the coin has formed a small hammer pattern, which is a bullish sign.
A reversal will be confirmed if JasmyCoin price plunges below the lower side of the hammer at $0.0065.

JASMY/USD chart by TradingView
Credit: Source link


 Bitcoin
  Ethereum
  XRP
XRP  Tether
  Solana
  USDC
USDC  Dogecoin
  Cardano
  Lido Staked Ether
  TRON
TRON  Chainlink
  Wrapped Bitcoin
  Avalanche
  Wrapped stETH
  Stellar
  Toncoin
  Sui
Sui  Hedera
  Shiba Inu
  WETH
WETH  LEO Token
  Polkadot
  Litecoin
  Bitget Token
  Bitcoin Cash
  Hyperliquid
  USDS
USDS  Uniswap
  Wrapped eETH
  Ethena USDe
  Pepe
Pepe  MANTRA
  NEAR Protocol
  Aave
Aave  Monero
  Official Trump
  Ondo
Ondo  WhiteBIT Coin
  Internet Computer
  Aptos
Aptos  Mantle
  Ethereum Classic
  Dai
Dai  Cronos
  POL (ex-MATIC)
  Bittensor
  OKB
OKB 
