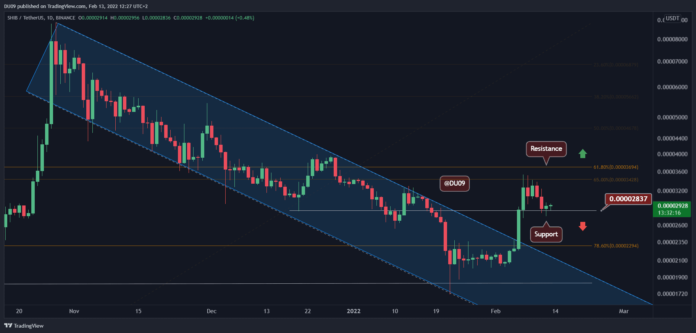
After an impressive rally last week, SHIB had seen a correction, facing the key support level. Will support hold?
Key Support level: $0.000028
Key Resistance levels: $0.000034
Last week, SHIB rallied over 50%, reaching our key resistance at $0.000034. Since then, the price corrected back to the support at $0.000028 and now consolidates above the level. If the sentiment remains bullish on Monday and key support holds – SHIB may see a renewed rally.
Technical Indicators
Trading Volume: Decreasing volume is becoming a concern for SHIB and its ambitions to go higher; this is usually a weakening sign of the current bullish trend. If this does not change, a break of the key resistance will become quite unlikely.
RSI: The daily RSI fell back to 56 points and has yet to reach the overbought area. This indicates that SHIB has enough fuel to initiate the bullish rally before another significant correction.
MACD: The daily MACD is bullish, but the histogram and moving averages are falling. This is not ideal but anticipated after such a strong rally last week.
Bias
The bias on SHIB is bullish unless key support is broken.
Short-Term Prediction for SHIB Price
As long as the price does not fall under the key support, SHIB has a good chance to go higher in the coming week. The only worry remains the falling volume which is impacting the bullish momentum. Things could change in SHIB’s favor in an instant, but this appears uncertain at the time of this post.
Binance Free $100 (Exclusive): Use this link to register and receive $100 free and 10% off fees on Binance Futures first month (terms).
PrimeXBT Special Offer: Use this link to register & enter POTATO50 code to receive up to $7,000 on your deposits.
Disclaimer: Information found on CryptoPotato is those of writers quoted. It does not represent the opinions of CryptoPotato on whether to buy, sell, or hold any investments. You are advised to conduct your own research before making any investment decisions. Use provided information at your own risk. See Disclaimer for more information.
Cryptocurrency charts by TradingView.
Credit: Source link


 Bitcoin
  Ethereum
  XRP
XRP  Tether
  Solana
  USDC
USDC  Dogecoin
  Cardano
  Lido Staked Ether
  TRON
TRON  Chainlink
  Wrapped Bitcoin
  Sui
Sui  Wrapped stETH
  Avalanche
  Stellar
  Hedera
  Toncoin
  Shiba Inu
  LEO Token
  Hyperliquid
  Bitget Token
  WETH
WETH  Litecoin
  USDS
USDS  Polkadot
  Bitcoin Cash
  Ethena USDe
  MANTRA
  Wrapped eETH
  Uniswap
  Ondo
Ondo  Pepe
Pepe  Monero
  Aave
Aave  WhiteBIT Coin
  NEAR Protocol
  Mantle
  Official Trump
  Aptos
Aptos  Dai
Dai  Internet Computer
  Ethereum Classic
  Bittensor
  Cronos
  OKB
OKB  POL (ex-MATIC)
  Gate
Gate 
