Data shows Bitcoin is currently retesting a major on-chain resistance level, and a break above which can potentially lead to a surge in its price.
Bitcoin Has Major On-Chain Resistance Around $67,000
As pointed out by analyst Ali in a post on X, BTC may be able to see a rise towards the $72,900 level if the asset can break the current on-chain resistance barrier.
In on-chain analysis, any level’s potential to act as support or resistance is measured using the amount of Bitcoin that was acquired/bought by the investors around said level.
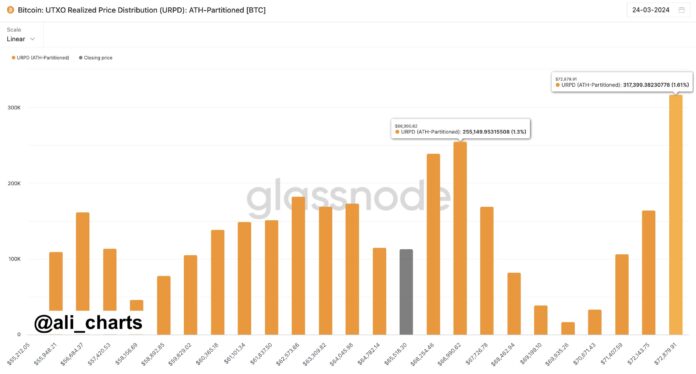
The analyst has shared the chart for the “UTXO Realized Price Distribution” (URPD) indicator from Glassnode, that reveals how the various levels around the current spot value of BTC are looking like right now based on the density of supply that was last bought at them.
Looks like there is significant resistance coming up ahead at the $72,900 mark | Source: @ali_charts on X
The URPD here is “ATH partitioned,” which means that the price ranges here are defined by dividing the levels between zero and the current all-time high (ATH) into 100 equal partitions.
From the chart, it’s visible that the partition around the $66,990 level carries the cost basis of a notable amount of the supply right now (1.3%). This also happens to be the range BTC is retesting at the moment.
Generally, the cost basis is a special level for investors, and thus, they tend to be more likely to show some reaction when a retest takes place. If a large number of holders share their cost basis inside the same narrow range, then this reaction may result in a scale that could be relevant for the market.
As for what direction this reaction from the holders would be probable to happen depends on the side the retest is happening from. A retest from under (meaning that these holders had been in loss prior to the retest) could lead to a selling reaction in the market.
This is because these investors may not want to risk the cryptocurrency declining again in the future, so exiting while they have the opportunity to at their break-even might be tempting.
As such, retests like these can lead to the asset feeling some degree of resistance. In the current case, the range is notably filled up with coins, so it’s possible that the strength of this resistance would be just as powerful.
From the chart, it’s visible that after this range, the asset potentially faces no strong on-chain resistance barriers until the $72,879 level, which hosts the cost basis of about 1.61% of the supply. “If Bitcoin can break past $66,990, it will likely rise toward $72,880!” says Ali.
BTC Price
Bitcoin has been climbing up in the past day, with its price now reaching the $67,200 level. Should this surge be sustained, the asset would be through the current resistance block.
The price of the coin appears to have been going up over the past couple of days | Source: BTCUSD on TradingView
Featured image from Kanchanara on Unsplash.com, Glassnode.com, chart from TradingView.com
Disclaimer: The article is provided for educational purposes only. It does not represent the opinions of NewsBTC on whether to buy, sell or hold any investments and naturally investing carries risks. You are advised to conduct your own research before making any investment decisions. Use information provided on this website entirely at your own risk.
Credit: Source link


 Bitcoin
  Ethereum
  XRP
XRP  Tether
  Solana
  USDC
USDC  Dogecoin
  Cardano
  Lido Staked Ether
  TRON
TRON  Chainlink
  Avalanche
  Wrapped Bitcoin
  Wrapped stETH
  Stellar
  Sui
Sui  Hedera
  Toncoin
  Shiba Inu
  Litecoin
  WETH
WETH  Polkadot
  Hyperliquid
  LEO Token
  Bitcoin Cash
  Bitget Token
  Uniswap
  USDS
USDS  Wrapped eETH
  Ethena USDe
  Pepe
Pepe  NEAR Protocol
  MANTRA
  Official Trump
  Ondo
Ondo  Aave
Aave  Aptos
Aptos  Internet Computer
  Monero
  WhiteBIT Coin
  Ethereum Classic
  Mantle
  Bittensor
  Cronos
  POL (ex-MATIC)
  Dai
Dai  OKB
OKB 
