Join Our Telegram channel to stay up to date on breaking news coverage
The Ethereum price prediction reveals that ETH is facing key support at $1,300 as the market price may gain more downs.
Ethereum Prediction Statistics Data:
- Ethereum price now – $1,326
- Ethereum market cap – $162.8 billion
- Ethereum circulating supply – 122.6 million
- Ethereum total supply – 122.6 million
- Ethereum Coinmarketcap ranking – #2
ETH/USD Market
Key Levels:
Resistance levels: $1700, $1500, $1300
Support levels: $1000, $800, $600
Buy Ethereum Now
Your capital is at risk
As soon as ETH/USD touches the resistance level of $1,326, the second-largest crypto begins to drop with a bearish bias. The coin opens at $1,352, and it is currently dropping toward the support level of $1,317. For the past few days, the Ethereum price has been moving sideways, trading around the 9-day and 21-day moving averages. The market price could correct higher, but it is likely to face more sellers below the moving averages.
Ethereum Price Prediction: Ethereum (ETH) May Head to the South
At the time of writing, the Ethereum price is ranging, but if it crosses below the 9-day and 21-day moving averages, it could break down heavily to gain more downtrends. However, ETH/USD is currently hovering at $1,326 as it prepares to face the downside. Should it spike to the south, the critical support levels of $1000, $800, and $600 may be found and the technical indicator Relative Strength Index (14) is moving to cross below the 40-level.
Meanwhile, on the upside, the next major resistance is near the $1600 level. But, the coin may hit the resistance levels of $1700, $1500, and $1300 should the coin head to the upside. If not, there is a risk of more downsides toward the lower boundary of the channel.
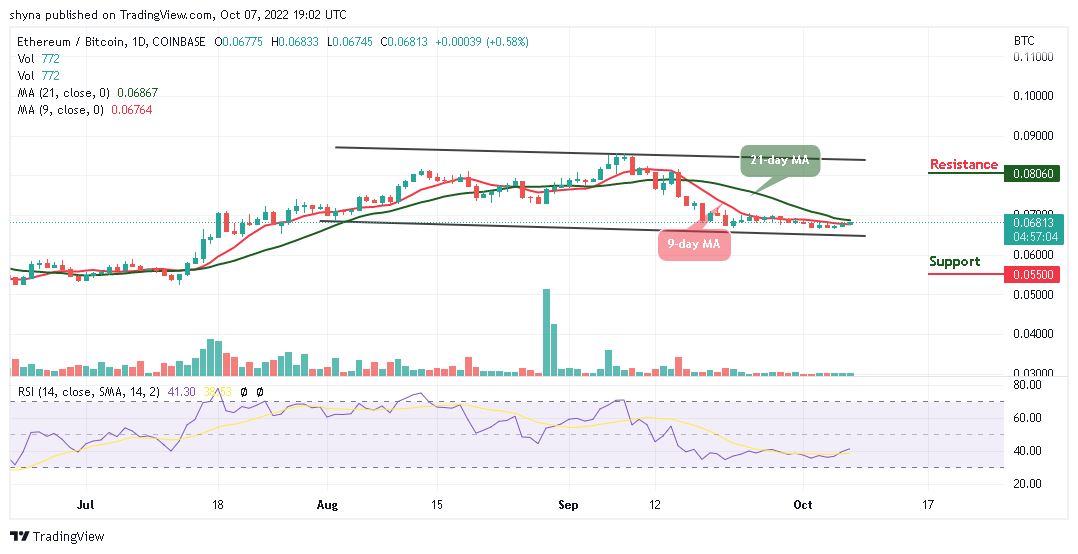
Against Bitcoin, the daily chart shows that the Ethereum price is likely to cross above the 21-day moving average. If the price faces the upper boundary of the channel, there is a possibility that the coin may gain additional resistance. The next resistance key above the 21-day MA is close to the 7000 SAT. If the price rises, it could even break the 8060 SAT and above in the next positive direction.

However, if the bears bring the price below the 9-day MA, 6000 SAT support may play out. Any further bearish movement could roll the coin to critical support at 5500 SAT and below. The Relative Strength Index (14) crosses above the 40-level, suggesting bullish signals.
Tamadoge – Play to Earn Meme Coin
- Earn TAMA in Battles With Doge Pets
- Maximum Supply of 2 Bn, Token Burn
- Now Listed on OKX, Bitmart, Uniswap
- Upcoming Listings on LBank, MEXC
Join Our Telegram channel to stay up to date on breaking news coverage
Credit: Source link


 Bitcoin
  Ethereum
  XRP
XRP  Tether
  Solana
  USDC
USDC  Dogecoin
  Cardano
  Lido Staked Ether
  TRON
TRON  Wrapped Bitcoin
  Wrapped stETH
  Chainlink
  Avalanche
  Sui
Sui  Stellar
  Litecoin
  Shiba Inu
  Toncoin
  Hedera
  LEO Token
  USDS
USDS  Hyperliquid
  Polkadot
  WETH
WETH  MANTRA
  Bitcoin Cash
  Ethena USDe
  Bitget Token
  Wrapped eETH
  Uniswap
  Monero
  NEAR Protocol
  Pepe
Pepe  WhiteBIT Coin
  Aave
Aave  Ondo
Ondo  Bittensor
  Aptos
Aptos  Internet Computer
  Dai
Dai  Official Trump
  Ethereum Classic
  Mantle
  Tokenize Xchange
  OKB
OKB  Gate
Gate  sUSDS
sUSDS  Coinbase Wrapped BTC
