Quick Take
RHODL Ratio
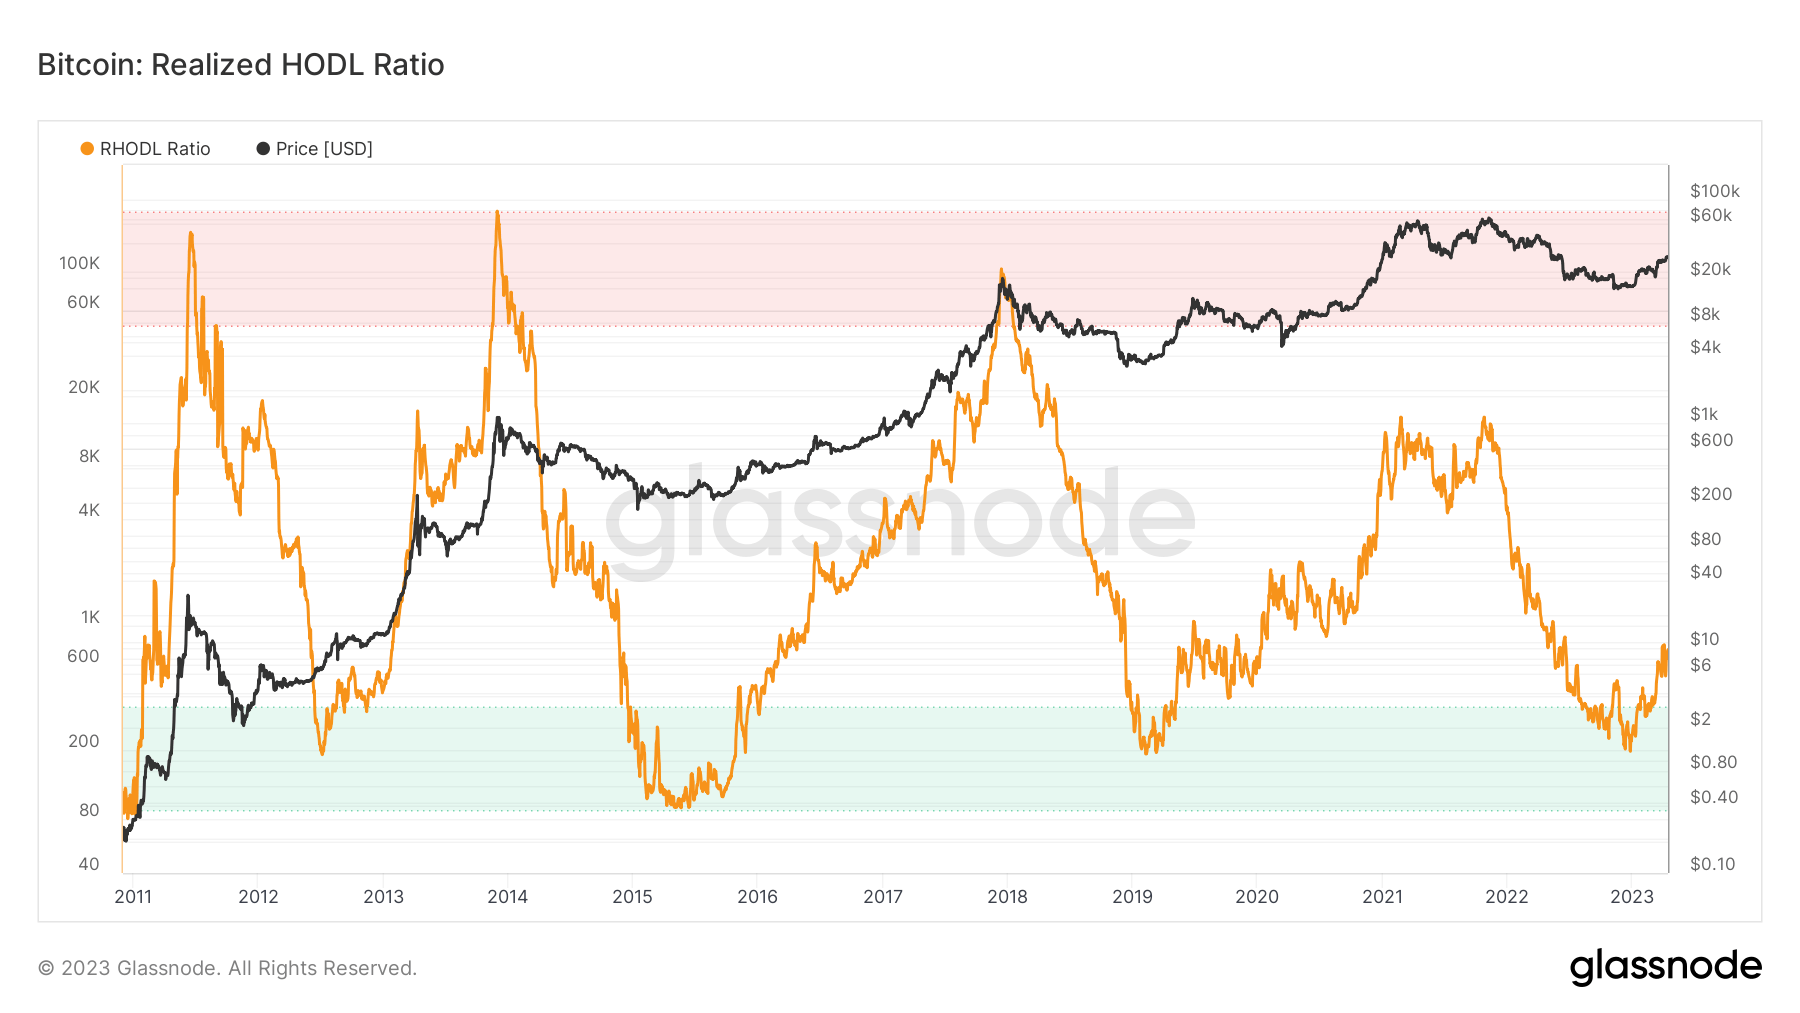
- The Bitcoin RHODL ratio looks at the capital rotation turning point across cycle transitions.
- The methodology behind the ratio is (Single-cycle Long-Term Holders) (6m-2y)/(1d-3m) to the youngest Short-Term Holders.Realized cap HODL waves
- While looking at the realized HODL ratio is a market indicator that uses a ratio of the Realized Cap HODL Waves. In particular, the RHODL Ratio takes the ratio between the one week and the 1-2 years RCap HODL bands.
- In addition, it accounts for increased supply by weighting the ratio by the total market age. A high ratio indicates an overheated market and can be used to time cycle tops.

Conclusion
Both these graphs conclude that the cycle bottom appears to be in from November 2022 during the FTX collapse. A case can be seen that the next bull run has started as the ratio has left the ‘green zone’ — while this cycle has plenty of room to run.
The post Cycle analysis, has the next leg for the bull run started for Bitcoin appeared first on CryptoSlate.
Credit: Source link


 Bitcoin
  Ethereum
  XRP
XRP  Tether
  Solana
  USDC
USDC  Dogecoin
  Cardano
  Lido Staked Ether
  TRON
TRON  Wrapped Bitcoin
  Wrapped stETH
  Chainlink
  Avalanche
  Sui
Sui  Stellar
  Litecoin
  Shiba Inu
  Toncoin
  Hedera
  LEO Token
  USDS
USDS  Hyperliquid
  Polkadot
  WETH
WETH  MANTRA
  Bitcoin Cash
  Ethena USDe
  Bitget Token
  Wrapped eETH
  Uniswap
  Monero
  NEAR Protocol
  Pepe
Pepe  WhiteBIT Coin
  Aave
Aave  Ondo
Ondo  Bittensor
  Aptos
Aptos  Internet Computer
  Dai
Dai  Official Trump
  Ethereum Classic
  Tokenize Xchange
  Mantle
  OKB
OKB  Gate
Gate  sUSDS
sUSDS  Coinbase Wrapped BTC
