In a recent technical analysis by crypto analyst Ali Martinez, known on social media as @ali_charts, a potential sell signal has been identified on the three-day chart for Cardano (ADA) against the US dollar. This analysis, shared on X on February 23, suggests caution among ADA traders due to the appearance of a bearish signal from the TD Sequential indicator.
Martinez’s chart showcases the TD Sequential indicator presenting a ‘9’ signal, a classic sell indication that suggests the current trend may be exhausted and a reversal could be imminent. This signal is highlighted on the candlestick that has been forming over the last three days, marked by a red rectangle surrounding a green candlestick.
The ‘9’ setup, traditionally seen as a sign to take profits or to prepare for a trend change, implies that ADA’s recent upward momentum may face a setback. The analysis further notes that this is not the first instance of such a signal appearing on Cardano’s chart.
Previous occurrences of the TD Sequential ‘9’ sell signal were followed by price corrections for ADA. Traders may be particularly vigilant now, as the chart indicates that the last two signals of this nature were succeeded by downward price action. Martinez remarked:
The TD Sequential indicator shows a sell signal on the #Cardano 3-day chart. It’s important to note that the last two times this indicator signaled bearish, ADA experienced a price correction!
How Low Could Cardano (ADA) Price Retrace?
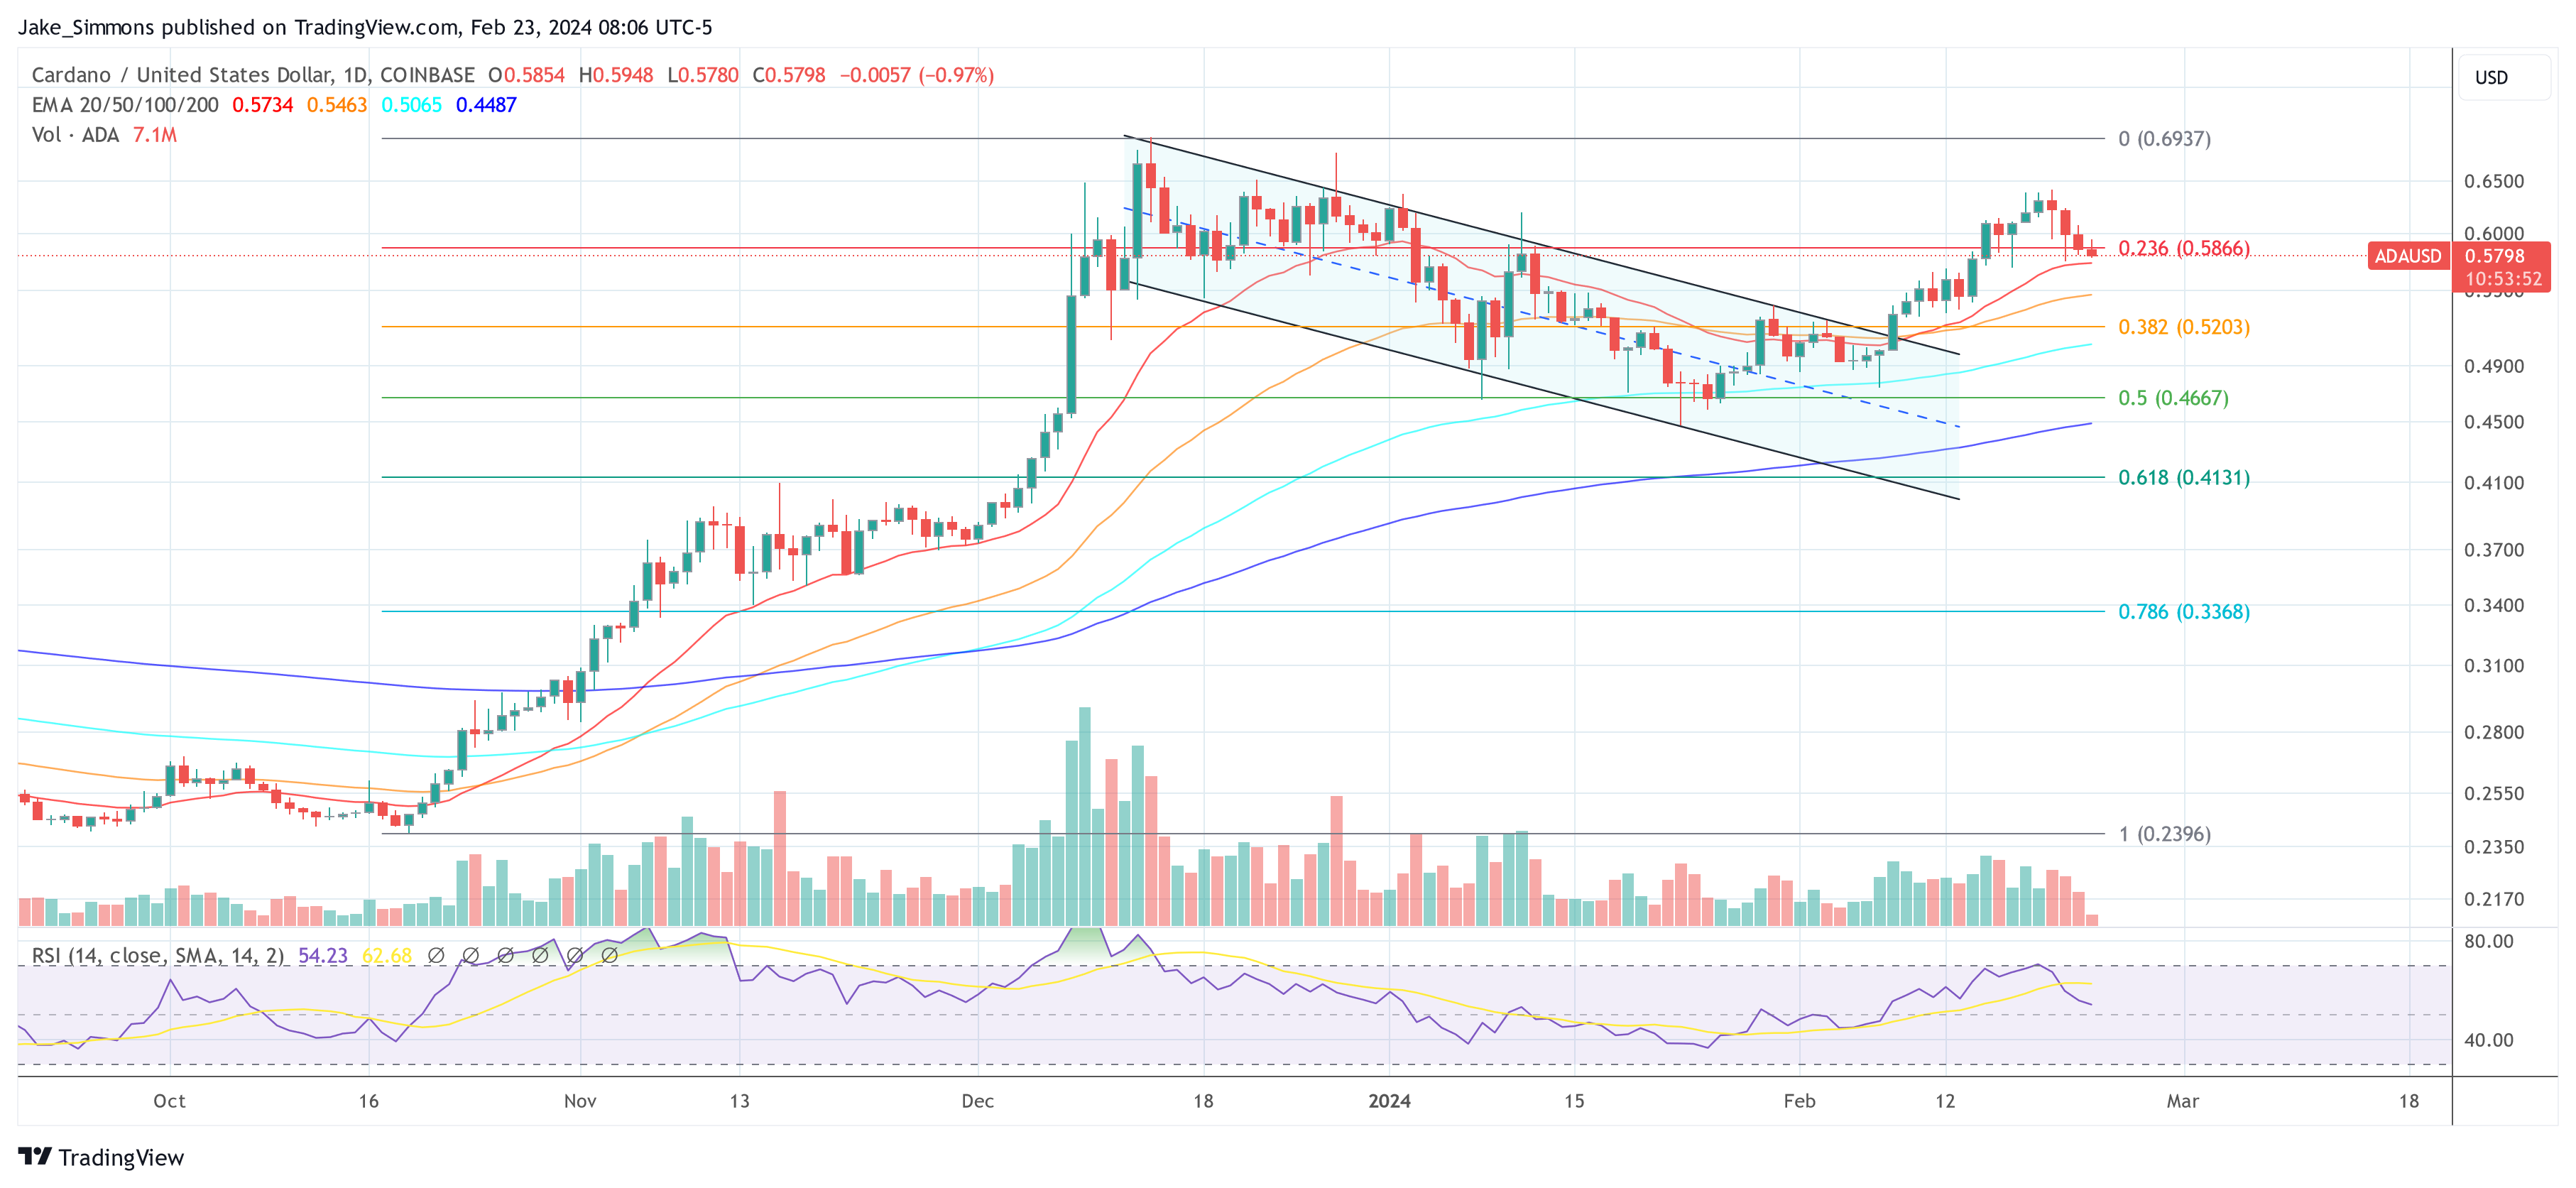
As of February 23, 13:06 UTC, the ADA/USD pair shows a complex interplay between bullish and bearish signals on the daily time frame. The chart presents a constricted pattern following a descent from a local high.
The ADA price is currently trading at $0.5790. Importantly, the price is above the 20-day Exponential Moving Average (EMA) at $0.5733, the 50-day EMA at $0.5462, the 100-day EMA at $0.5065 and notably, the 200-day EMA at $0.4487. The positioning above these EMAs can be a sign of an underlying bullish sentiment in the market.

The Fibonacci retracement levels, drawn from the peak to the trough of the recent move, highlight significant levels of potential support and resistance. The 0.236 level at $0.5866 is immediately overhead, acting as a minor resistance level. The 0.382 level at $0.5203 and the 0.5 level at $0.4667 are key support zones to watch if a bearish reversal occurs.
A break below these levels could signal a deeper retracement towards the 0.618 level at $0.4131 or even the 0.786 level at $0.3368. However, the most crucial support at the moment is the 20-day EMA which could forebode a changing trend.
Notably, the volume has been relatively consistent, with a slight decrease in trading volume accompanying the recent price consolidation. This could indicate a lack of conviction among traders. Confirming this, the Relative Strength Index (RSI) is at 54, indicating neither overbought nor oversold conditions. The RSI trend is neutral, providing no clear directional bias at the moment.
In conclusion, while there are hints of bearishness, there are still good arguments to be bullish on Cardano and not wait for a larger correction. However, if the price does not hold above several key EMAs on the daily chart, the trend change could be confirmed.
Featured image created with DALL·E, chart from TradingView.com
Disclaimer: The article is provided for educational purposes only. It does not represent the opinions of NewsBTC on whether to buy, sell or hold any investments and naturally investing carries risks. You are advised to conduct your own research before making any investment decisions. Use information provided on this website entirely at your own risk.
Credit: Source link


 Bitcoin
  Ethereum
  XRP
XRP  Tether
  Solana
  USDC
USDC  Dogecoin
  Cardano
  Lido Staked Ether
  TRON
TRON  Chainlink
  Avalanche
  Wrapped Bitcoin
  Wrapped stETH
  Stellar
  Sui
Sui  Toncoin
  Hedera
  Shiba Inu
  Litecoin
  WETH
WETH  Polkadot
  LEO Token
  Hyperliquid
  Bitcoin Cash
  Bitget Token
  Uniswap
  USDS
USDS  Wrapped eETH
  Ethena USDe
  Pepe
Pepe  MANTRA
  NEAR Protocol
  Official Trump
  Ondo
Ondo  Aave
Aave  Aptos
Aptos  Internet Computer
  Monero
  WhiteBIT Coin
  Mantle
  Ethereum Classic
  Bittensor
  Dai
Dai  Cronos
  POL (ex-MATIC)
  OKB
OKB 
