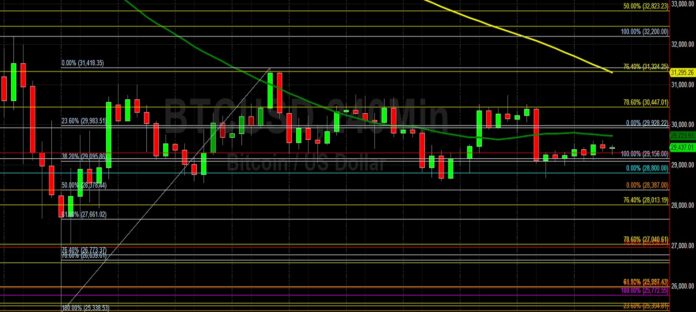
Bitcoin (BTC/USD) lacked significant upward pressure early in the Asian session as the pair continued to struggle, having lost approximately 21.8% month-to-date. Strong selling pressure recently intensified around the 30512 area and knocked BTC/USD back below the psychologically-important 30000 figure. The move to recent lows opened up possible tests of additional short-term technical support around the 28378, 27661, 26773, and 26639 levels. Traders continue to eye the 30447 area, a level that represents the 78.6% retracement of the recent appreciating range from 21913.84 to 61788.45. Traders observe that the recent low around the 25338.53 area represented a test of the 23.6% retracement of a historical appreciating range from the 15708.24 level to the 28387 area, and was also above the 24365.11 area, a downside price objective related to selling pressure that emerged around the 48240 area.
Stops were elected below many downside price objectives during the ongoing descent, including the 30435, 29645, 28927, and 28426 areas, downside price objectives related to selling pressure that intensified around the 47469, 47200, and 48240 areas. If BTC/USD continues to depreciate, traders are eyeing additional downside price objectives around the 25142, 24365, and 21074 areas. Significant selling pressure hastened around the 31717, 31364, and 31289 areas, upside technical price objectives and retracement levels related to historical buying pressure around the 3858 area. Traders are observing that the 50-bar MA (4-hourly) is bearishly indicating below the 100-bar MA (4-hourly) and below the 200-bar MA (4-hourly). Also, the 50-bar MA (hourly) is bearishly indicating below the 100-bar MA (hourly) and below the 200-bar MA (hourly).
Price activity is nearest the 50-bar MA (4-hourly) at 29723.84 and the 50-bar MA (Hourly) at 29570.19.
Technical Support is expected around 24365.11/ 21074.87/ 20495.33 with Stops expected below.
Technical Resistance is expected around 40100.93/ 41570.88/ 43443.32 with Stops expected above.
On 4-Hourly chart, SlowK is Bullishly above SlowD while MACD is Bearishly below MACDAverage.
On 60-minute chart, SlowK is Bullishly above SlowD while MACD is Bullishly above MACDAverage.
Disclaimer: This trading analysis is provided by a third party, and for informational purposes only. It does not reflect the views of Crypto Daily, nor is it intended to be used as legal, tax, investment, or financial advice.
Credit: Source link


 Bitcoin
  Ethereum
  XRP
XRP  Tether
  Solana
  USDC
USDC  Dogecoin
  Cardano
  Lido Staked Ether
  TRON
TRON  Chainlink
  Wrapped Bitcoin
  Avalanche
  Wrapped stETH
  Stellar
  Sui
Sui  Toncoin
  Hedera
  Shiba Inu
  WETH
WETH  LEO Token
  Polkadot
  Litecoin
  Bitget Token
  Bitcoin Cash
  Hyperliquid
  USDS
USDS  Uniswap
  Wrapped eETH
  Ethena USDe
  Pepe
Pepe  MANTRA
  NEAR Protocol
  Aave
Aave  Monero
  Ondo
Ondo  Official Trump
  WhiteBIT Coin
  Internet Computer
  Aptos
Aptos  Mantle
  Ethereum Classic
  Dai
Dai  Cronos
  Bittensor
  POL (ex-MATIC)
  OKB
OKB 
