While many bitcoin investors look for the asset to behave as a safe haven, bitcoin typically has ultimately acted as the riskiest of all risk allocations.
The below is an excerpt from a recent edition of Bitcoin Magazine PRO, Bitcoin Magazine’s premium markets newsletter. To be among the first to receive these insights and other on-chain bitcoin market analysis straight to your inbox, subscribe now.
Short-Term Price Versus Long-Term Thesis
How bitcoin, the asset, will behave in the future versus how it currently trades in the market have proven to be drastically different from our long-term thesis. In this piece, we’re taking a deeper look into those risk-on correlations, and comparing the returns and correlations across bitcoin and other asset classes.
Consistently, tracking and analyzing these correlations can give us a better understanding if and when bitcoin has a real decoupling moment from its current trend. We don’t believe we are in that period today, but expect that decoupling to be more likely over the next five years.
Macro Drives Correlations
For starters, we’re looking at the correlations of one-day returns for bitcoin and many other assets. Ultimately we want to know how bitcoin moves relative to other major asset classes. There’s a lot of narratives on what bitcoin is and what it could be, but that’s different from how the market trades it.
Correlations range from negative one to one and indicate how strong of a relationship there is between two variables, or asset returns in our case. Typically, a strong correlation is above 0.75 and a moderate correlation is above 0.5. Higher correlations show that assets are moving in the same direction with the opposite being true for negative or inverse correlations. Correlations of 0 indicate a neutral position or no real relationship. Looking at longer windows of time gives a better indication on the strength of a relationship because this removes short-term, volatile changes.
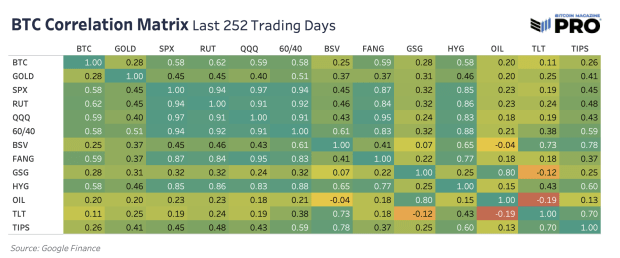
What’s been the most watched correlation with bitcoin over the last two years is its correlation with “risk-on” assets. Comparing bitcoin to traditional asset classes and indexes over the last year or 252 trading days, bitcoin is most correlated with many benchmarks of risk: S&P 500 Index, Russel 2000 (small cap stocks), QQQ ETF, HYG High Yield Corporate Bond ETF and the FANG Index (high-growth tech). In fact, many of these indexes have a strong correlation to each other and goes to show just how strongly correlated all assets are in this current macroeconomic regime.
The table below compare bitcoin to some key asset-class benchmarks across high beta, equities, oil and bonds.
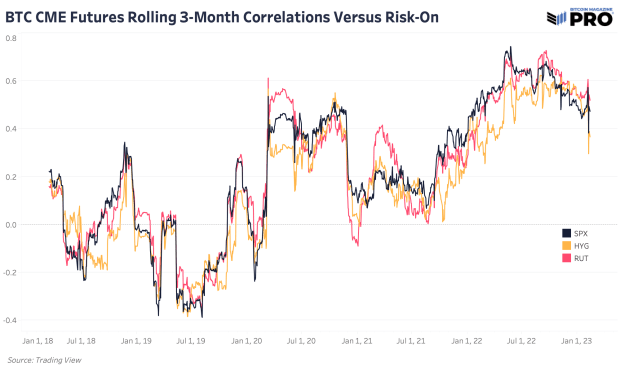
Another important note is that spot bitcoin trades in a 24/7 market while these other assets and indexes do not. Correlations are likely understated here as bitcoin has proven to lead broader risk-on or liquidity market moves in the past because bitcoin can be traded at any time. As bitcoin’s CME futures market has grown, using this futures data produces a less volatile view of correlation changes over time as it trades within the same time limitations as traditional assets.

Looking at the rolling 3-month correlations of bitcoin CME futures versus a few of the risk-on indexes mentioned above, they all track nearly the same.

Although bitcoin has had its own, industry-wide capitulation and deleveraging event that rival many historical bottoming events we’ve seen in the past, these relationships to traditional risk haven’t changed much.
Bitcoin has ultimately acted as the riskiest of all risk allocations and as a liquidity sponge, performing well at any hints of expanding liquidity coming back into the market. It reverses with the slightest sign of rising equities volatility in this current market regime.
We do expect this dynamic to substantially change over time as the understanding and adoption of Bitcoin accelerates. This adoption is what we view as the asymmetric upside to how bitcoin trades today versus how it will trade 5-10 years from now. Until then, bitcoin’s risk-on correlations remain the dominant market force in the short-term and are key to understanding its potential trajectory over the next few months.
Read the full article here.
Like this content? Subscribe now to receive PRO articles directly in your inbox.

Relevant Articles:
- A Rising Tide Lifts All Boats: Bitcoin, Risk Assets Jump With Increased Global Liquidity
- The Everything Bubble: Markets At A Crossroads
- Just How Big Is The Everything Bubble?
- Not Your Average Recession: Unwinding The Largest Financial Bubble In History
- Brewing Emerging Market Debt Crises
- Evaluating Bitcoin’s Risk-On Tendencies
- The Unfolding Sovereign Debt & Currency Crisis
Credit: Source link


 Bitcoin
  Ethereum
  XRP
XRP  Tether
  Solana
  USDC
USDC  Dogecoin
  Cardano
  Lido Staked Ether
  TRON
TRON  Wrapped Bitcoin
  Wrapped stETH
  Chainlink
  Avalanche
  Sui
Sui  Stellar
  Litecoin
  Toncoin
  Shiba Inu
  Hedera
  LEO Token
  USDS
USDS  Hyperliquid
  Polkadot
  WETH
WETH  MANTRA
  Bitcoin Cash
  Bitget Token
  Ethena USDe
  Wrapped eETH
  Uniswap
  Monero
  NEAR Protocol
  Pepe
Pepe  WhiteBIT Coin
  Aave
Aave  Ondo
Ondo  Bittensor
  Aptos
Aptos  Internet Computer
  Dai
Dai  Official Trump
  Mantle
  Ethereum Classic
  Tokenize Xchange
  OKB
OKB  Gate
Gate  sUSDS
sUSDS  Coinbase Wrapped BTC
