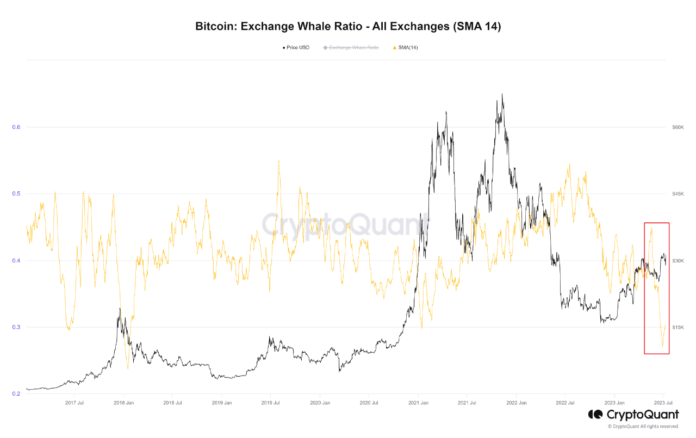
On-chain data shows that the Bitcoin exchange whale ratio has declined to the lowest value since 2018. Here’s what this may mean for the asset.
Bitcoin Exchange Whale Ratio (14-Day SMA) Has Plunged Recently
As an analyst in a CryptoQuant post pointed out, whale activity on exchanges has been dropping recently. The “exchange whale ratio” is an indicator that measures the ratio between the sum of the top ten Bitcoin transactions going to exchanges and the total exchange inflows.
Generally, the ten largest transfers heading towards exchanges are coming from the whales, so this ratio can tell us how the inflow from the whales compares with that of the entire market right now.
When the value of this metric is high, it means that these humongous investors are making up a large part of the total inflows. Depending on the type of platform these deposits are headed exactly, this trend may be a sign that the whales are currently dumping.
On the other hand, low values suggest whales are making up for a relatively healthy portion of the current inflows. Such a trend may imply that these holders aren’t interested in using the exchanges’ services.
Now, here is a chart that shows the trend in the 14-day simple moving average (SMA) Bitcoin exchange whale ratio over the last few years:
Looks like the 14-day SMA value of the metric has been declining in recent weeks | Source: CryptoQuant
The above graph shows that the 14-day SMA Bitcoin exchange whale ratio has recently plunged. This would suggest that the whales haven’t contributed that much toward the total market inflows.
What impact the price may feel from this depends on the specific type of platform behind this trend. The exchange whale ratio used here is for all exchanges, meaning it includes data for both spot and derivative platforms.
Below is the version of the Bitcoin exchange whale ratio that considers only inflows toward spot exchanges.

The value of the metric seems to have not changed much recently | Source: CryptoQuant
From the chart, it’s visible that the 14-day SMA exchange whale ratio for the spot exchanges hasn’t changed much in the last few months, meaning that it has been business as usual for the whales regarding these platforms.
If the plunge in the all exchanges version of the indicator hasn’t come from the spot exchanges, it must have been due to the derivative exchanges. As the graph below confirms, whale inflows on these platforms appear to have dropped steeply.

The metric has rapidly declined | Source: CryptoQuant
The fact that whales haven’t been depositing much to derivative exchanges recently suggests that they may be currently avoiding the risk of leveraged futures trading.
Generally, more leverage in the market leads to higher volatility for the price, so these humongous holders staying away from derivatives trading, for now, may mean that the market won’t suffer from violent liquidation events shortly.
BTC Price
At the time of writing, Bitcoin is trading around $30,200, down 2% in the last week.
BTC hasn't moved much in the last few days | Source: BTCUSD on TradingView
Featured image from Rémi Boudousquié on Unsplash.com, charts from TradingView.com, CryptoQuant.com
Credit: Source link


 Bitcoin
  Ethereum
  XRP
XRP  Tether
  Solana
  USDC
USDC  Dogecoin
  Cardano
  Lido Staked Ether
  TRON
TRON  Wrapped Bitcoin
  Wrapped stETH
  Chainlink
  Avalanche
  Sui
Sui  Stellar
  Litecoin
  Shiba Inu
  Toncoin
  Hedera
  LEO Token
  USDS
USDS  Hyperliquid
  WETH
WETH  Polkadot
  MANTRA
  Bitcoin Cash
  Bitget Token
  Ethena USDe
  Wrapped eETH
  Uniswap
  Monero
  NEAR Protocol
  Pepe
Pepe  WhiteBIT Coin
  Aave
Aave  Ondo
Ondo  Bittensor
  Aptos
Aptos  Internet Computer
  Dai
Dai  Official Trump
  Ethereum Classic
  Tokenize Xchange
  Mantle
  OKB
OKB  Gate
Gate  sUSDS
sUSDS  Coinbase Wrapped BTC
