Bitcoin Price Prediction – October 14
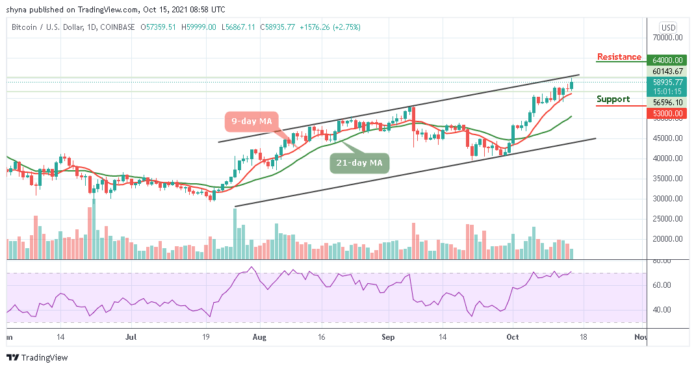
The Bitcoin price touches the daily high of $59,999, the coin is holding above $59,000 level and it may likely retest $58,000 before rising again.
BTC/USD Long-term Trend: Bullish (Daily Chart)
Key levels:
Resistance Levels: $64,000, $66,000, $68,000
Support Levels: $53,000, $51, 000, $49,000
BTC/USD has been extremely volatile as the coin touches the daily high of $59,999 and after touching the daily low of $56,867. At the moment, BTC/USD is in an ascending channel forming higher highs and higher lows. Therefore, since the price is above the 9-day and 21-day moving averages, it indicates that a break above the channel may likely come to play.
Bitcoin Price Prediction: Bitcoin (BTC) May Trade Above $60,000
According to the daily chart, if the Bitcoin price keeps hovering near the upper boundary of the channel, traders can expect a cross above the upper boundary of the channel. However, it is important to note that the red-line of 9-day MA is still above the green-line of the 21-day MA which confirms the presence of the bullish trend.
In the meantime, if the Bitcoin price drives below the 9-day moving average, it could see support levels at $53,000, $51,000, and $49,000, bringing the price to a new low. Meanwhile, a strong buying pressure may take the price to the resistance level of $60,000. While trading at that level, a bullish continuation could hit the potential resistance levels of $64,000, $66,000, and $68,000 as the Relative Strength Index (14) is likely to cross into the overbought region.

BTC/USD Medium – Term Trend: Bullish (4H Chart)
Looking at the 4-hour chart, BTC/USD remains trading above the 9-day and 21-day moving averages. Nevertheless, Bitcoin has not yet slipped below this barrier as it is still in the loop of making a bounce back. Therefore, BTC price hovers around $59,337 and may take time to trade above the upper boundary of the channel. The upward movement could face the resistance levels of $62,000 and above.

However, on the downside, immediate support is below the moving averages while the main support is at the $58000 level. The price might slide sharply below $57,500 which may likely test the main support at $57,000 level. More so, BTC/USD is likely to face more losses in the near-term as the Relative Strength Index (14) nosedives below 65-level, indicating a reversal for the bearish movement.
Looking to buy or trade Bitcoin (BTC) now? Invest at eToro!
67% of retail investor accounts lose money when trading CFDs with this provider
Read more:
Credit: Source link


 Bitcoin
  Ethereum
  XRP
XRP  Tether
  Solana
  USDC
USDC  Dogecoin
  Cardano
  Lido Staked Ether
  TRON
TRON  Wrapped Bitcoin
  Chainlink
  Wrapped stETH
  Avalanche
  Sui
Sui  Stellar
  Litecoin
  Toncoin
  Shiba Inu
  LEO Token
  Hedera
  USDS
USDS  Hyperliquid
  Polkadot
  WETH
WETH  MANTRA
  Bitcoin Cash
  Bitget Token
  Ethena USDe
  Wrapped eETH
  Uniswap
  Monero
  NEAR Protocol
  WhiteBIT Coin
  Pepe
Pepe  Aave
Aave  Ondo
Ondo  Bittensor
  Aptos
Aptos  Internet Computer
  Dai
Dai  Official Trump
  Mantle
  Ethereum Classic
  Tokenize Xchange
  OKB
OKB  Gate
Gate  Sonic (prev. FTM)
  sUSDS
sUSDS 
