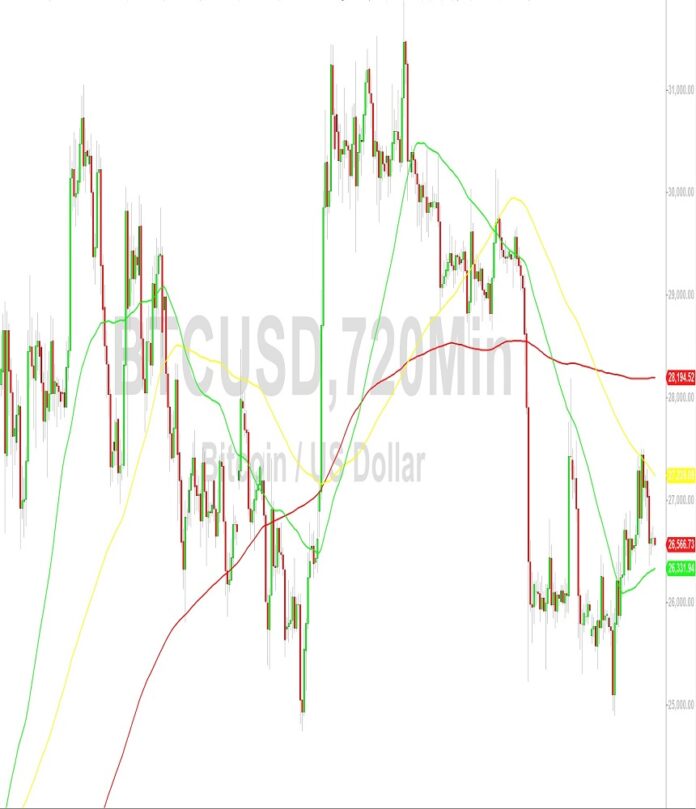
Bitcoin Price Analysis: Consolidation of 2023’s Gains Continues – 25 September 2023
Bitcoin (BTC/USD) sought new technical guidance early in the Asian session as the pair continued to trade around the 26585 level, a downside price objective associated with recent selling pressure around the 30222 and 28184 levels. The 200-bar, 4-hour simple moving average has provided technical support during the past several trading sessions but recent struggles below the 200-hour simple moving average could project more downward pressure. Major Stops were recently elected below the 25298.02 area during the depreciation to the 24900 level as bears tested bids above the 24197.68 area, a major downside price objective related to selling pressure around the 31862 and 30222 levels.
Stops are accruing below some downside price objectives including the 24155, 23270, 23204, 23164, 22949, 22028, 21496, 21242, and 20702 areas. Above current price activity, areas of technical resistance and potential selling pressure include the 26795, 26929, 27064, 27230, and 27255 levels. Three key levels that technicians continue to monitor include the 29514, 23438, and 20195 levels, areas related to selling pressure around the 69000, 59249, and 52100 levels. Traders are observing that the 50-bar MA (4-hourly) is bullishly indicating above the 100-bar MA (4-hourly) and above the 200-bar MA (4-hourly). Also, the 50-bar MA (hourly) is bearishly indicating below the 100-bar MA (hourly) and above the 200-bar MA (hourly).
Price activity is nearest the 50-bar MA (4-hourly) at 26745.07 and the 200-bar MA (Hourly) at 26734.17.
Technical Support is expected around 24440.41/ 23270.10/ 22769.39 with Stops expected below.
Technical Resistance is expected around 31986.16/ 32989.19/ 34658.69 with Stops expected above.
On 4-Hourly chart, SlowK is Bullishly above SlowD while MACD is Bearishly below MACDAverage.
On 60-minute chart, SlowK is Bearishly below SlowD while MACD is Bullishly above MACDAverage.
Sally Ho’s Technical Analysis
View Yesterday’s Trading Analysis
Disclaimer: Sally Ho’s Technical Analysis is provided by a third party, and for informational purposes only. It does not reflect the views of Crypto Daily, nor is it intended to be used as legal, tax, investment, or financial advice.
Credit: Source link


 Bitcoin
  Ethereum
  XRP
XRP  Tether
  Solana
  USDC
USDC  Dogecoin
  Cardano
  Lido Staked Ether
  TRON
TRON  Chainlink
  Avalanche
  Wrapped Bitcoin
  Wrapped stETH
  Stellar
  Sui
Sui  Toncoin
  Hedera
  Shiba Inu
  WETH
WETH  LEO Token
  Litecoin
  Polkadot
  Bitget Token
  Bitcoin Cash
  Hyperliquid
  USDS
USDS  Uniswap
  Wrapped eETH
  Ethena USDe
  Pepe
Pepe  MANTRA
  NEAR Protocol
  Aave
Aave  Monero
  Ondo
Ondo  WhiteBIT Coin
  Aptos
Aptos  Internet Computer
  Official Trump
  Mantle
  Ethereum Classic
  Dai
Dai  Cronos
  POL (ex-MATIC)
  Bittensor
  OKB
OKB 
