BTC/USD Better After 29427 Test: Sally Ho’s Technical Analysis – 2 July 2023
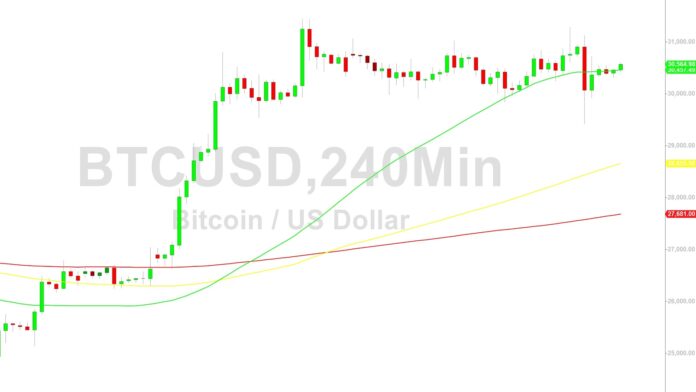
Bitcoin (BTC/USD) worked to remain above the 30000 figure early in the Asian session as the pair encountered month-ending volatility that saw a rapid depreciation to the 29417.14 area, representing a test of the 38.2% retracement of the appreciating range from 26165.98 to 31443.67. This quick downward move took place shortly after BTC/USD spiked higher to the 30277 area, its strongest print in several trading sessions, and opens up a possible test of the 28604.83 area. BTC/USD notched a June gain of approximately 11.9%, and the pair is now up approximately 83.5% year-to-date. The pair’s recent print around the 31443.67 area was a twelve-month high and test of an upside price objective associated with buying pressure that strengthened around the 26637.41 area. Additional upside price objectives include the 31737, 32125, and 33569 areas. Stops are cited above additional upside price objectives around the 31674, 32043, 34531, and 34658 areas.
Following recent selling pressure, areas of potential technical support and buying pressure include the 29863, 29427, 28886, 28804, 28182, 28096, and 27306 areas. Stops were also recently triggered above additional upside price objectives around the 29068, 29159, 29458, 30088, 30200, 30292, and 30477 levels. Technicians are closely watching to see how much technical support develops around the 28095.44 area, representing the 23.6% retracement of the historical depreciating range from 69000 to 15460. Traders are observing that the 50-bar MA (4-hourly) is bullishly indicating above the 100-bar MA (4-hourly) and above the 200-bar MA (4-hourly). Also, the 50-bar MA (hourly) is bullishly indicating above the 100-bar MA (hourly) and above the 200-bar MA (hourly).
Price activity is nearest the 50-bar MA (4-hourly) at 30456.83 and the 50-bar MA (Hourly) at 30515.87.
Technical Support is expected around 24440.41/ 23270.10/ 22769.39 with Stops expected below.
Technical Resistance is expected around 31986.16/ 32989.19/ 34658.69 with Stops expected above.
On 4-Hourly chart, SlowK is Bullishly above SlowD while MACD is Bearishly below MACDAverage.
On 60-minute chart, SlowK is Bullishly above SlowD while MACD is Bullishly above MACDAverage.
Disclaimer: Sally Ho’s Technical Analysis is provided by a third party, and for informational purposes only. It does not reflect the views of Crypto Daily, nor is it intended to be used as legal, tax, investment, or financial advice.
Credit: Source link


![Dogecoin [DOGE] January End Price Prediction](https://news.coinspectra.com/wp-content/uploads/2024/01/kanchanara-pQEfJZYDpL0-unsplash-100x70.jpg)


 Bitcoin
  Ethereum
  XRP
XRP  Tether
  Solana
  USDC
USDC  Dogecoin
  Cardano
  Lido Staked Ether
  TRON
TRON  Chainlink
  Avalanche
  Wrapped Bitcoin
  Wrapped stETH
  Stellar
  Sui
Sui  Hedera
  Toncoin
  Shiba Inu
  Litecoin
  WETH
WETH  Polkadot
  Hyperliquid
  LEO Token
  Bitcoin Cash
  Bitget Token
  Uniswap
  USDS
USDS  Wrapped eETH
  Ethena USDe
  Pepe
Pepe  NEAR Protocol
  MANTRA
  Official Trump
  Ondo
Ondo  Aave
Aave  Aptos
Aptos  Internet Computer
  Monero
  WhiteBIT Coin
  Ethereum Classic
  Mantle
  Bittensor
  Cronos
  POL (ex-MATIC)
  Dai
Dai  OKB
OKB 
