Data shows both Bitcoin and Ethereum have observed a spike in the transaction fees over the past couple of days as holders have rushed to sell amid the crash.
Bitcoin & Ethereum Transaction Fees Shoot Up
The “transaction fees” is an amount that users making transactions on the network have to pay in order to send the transfers through.
Depending on the crypto network, either part of the transaction fee or the entirety of it goes to the miners (or the validators).
When there are a large number of transactions happening on the network and the mempool becomes clogged, these miners start prioritizing transactions with the highest fees attached to them.
Related Reading | Market Liquidations Cross $1.22 Billion Following Bitcoin’s Decline Below $23,000
In such times, users who want their transfers to go through quicker and not be stuck waiting start putting a higher fee.
If network activity remains raised, users start paying an even higher fees in order to outcompete the others, thus leading to the network average shooting up.
As pointed out by an analyst in a CryptoQuant post, the Bitcoin mean fees per transaction observed a large spike as the crypto’s price plummeted down.
The below chart shows this trend in the indicator.
Looks like the average fees on the BTC network spiked up yesterday | Source: CryptoQuant
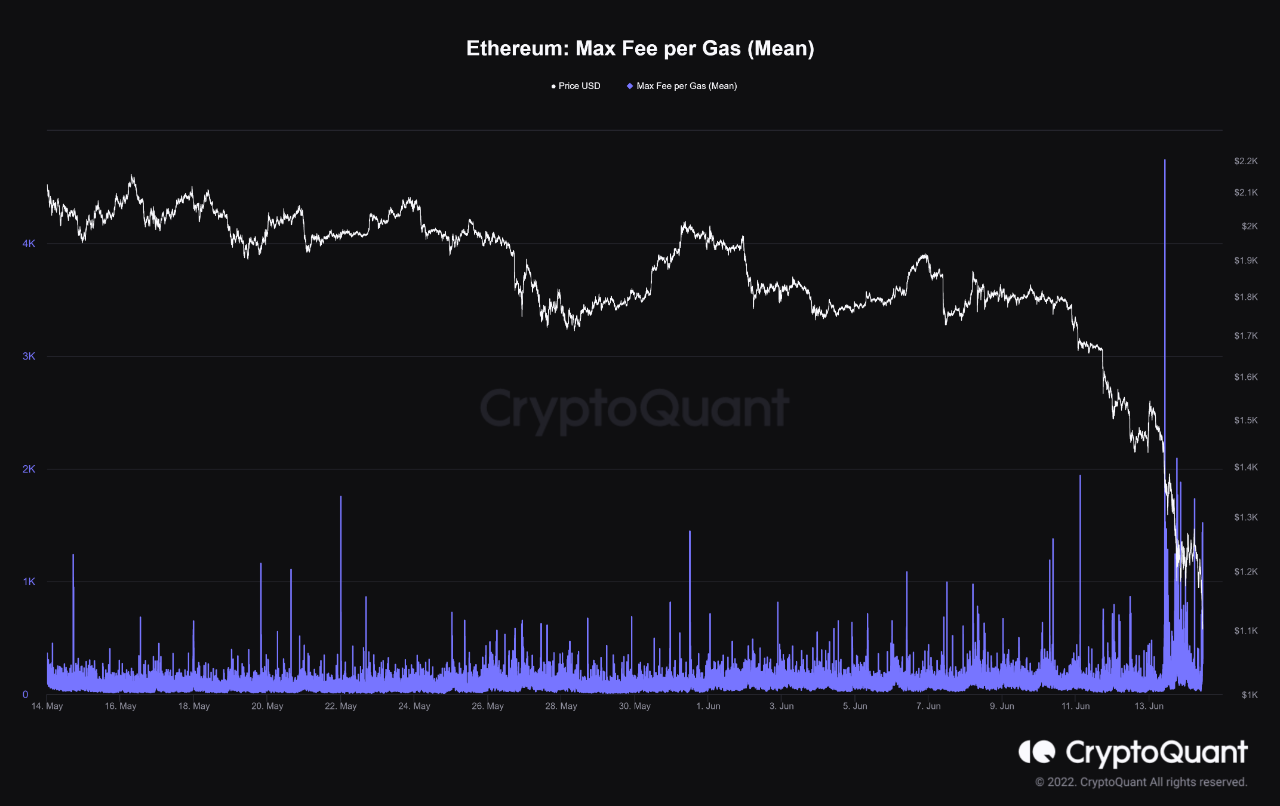
Much like BTC, the Ethereum blockchain also saw a huge increase in demand over the past day as investors rushed to sell during the crash.
Here is a chart that shows the trend in the ETH mean max fees per gas over the past few weeks:

The value of the metric seems to have been raised over the past couple of days | Source: CryptoQuant
The “max fee” is the fee per gas that users can maximally attach when submitting a transaction on the Ethereum network.
Related Reading | Bitcoin Will Hit $100K In 12 Months, Ex-White House Chief Predicts, Despite Crypto Carnage
BTC & ETH Price
At the time of writing, Bitcoin’s price floats around $22k, down 25% in the last seven days. Over the past month, the crypto has shed 25% in value.
The below chart shows the trend in the price of the coin over the last five days.

BTC went to as low as below $21k before rebounding back to the current level of $22k | Source: BTCUSD on TradingView
As for Ethereum, the crypto is trading around $1.2k right now, down 32% in the past week. Monthly losses for the coin stand at 41%.
Below is the price chart for ETH over the last five days.

ETH went down to a low of less than $1.1k during the crash over the past couple of days | Source: ETHUSD on TradingView
Featured image from Unsplash.com, charts from TradingView.com, CryptoQuant.com
Credit: Source link


 Bitcoin
  Ethereum
  XRP
XRP  Tether
  Solana
  USDC
USDC  Dogecoin
  Cardano
  Lido Staked Ether
  TRON
TRON  Wrapped Bitcoin
  Chainlink
  Wrapped stETH
  Avalanche
  Sui
Sui  Stellar
  Litecoin
  Toncoin
  Shiba Inu
  Hedera
  LEO Token
  USDS
USDS  Hyperliquid
  Polkadot
  WETH
WETH  MANTRA
  Bitcoin Cash
  Bitget Token
  Ethena USDe
  Wrapped eETH
  Uniswap
  Monero
  NEAR Protocol
  Pepe
Pepe  WhiteBIT Coin
  Aave
Aave  Bittensor
  Ondo
Ondo  Aptos
Aptos  Internet Computer
  Dai
Dai  Official Trump
  Ethereum Classic
  Mantle
  Tokenize Xchange
  OKB
OKB  Gate
Gate  sUSDS
sUSDS  Sonic (prev. FTM)
