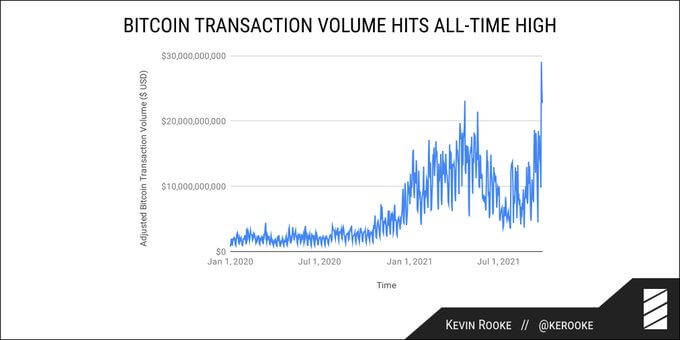
Researcher Kevin Rooke noted that daily transaction volume on the Bitcoin network hit an all-time high of $29 billion on Sunday.
Rooke also pointed out that there have only been 5 days in Bitcoin’s history when the network settled above $20 billion. Three of which occurred this week.

But what does this mean, especially within the context of current market conditions?
Is Bitcoin about to bounce back?
Recently, a confluence of factors has increased sell pressure in both stock and crypto markets. Most notable is the unfolding $300 billion liquidity crisis at Chinese property giant Evergrande.
Last week, Chinese regulators also renewed their efforts to crack down on all cryptocurrency transactions, including mining activity.
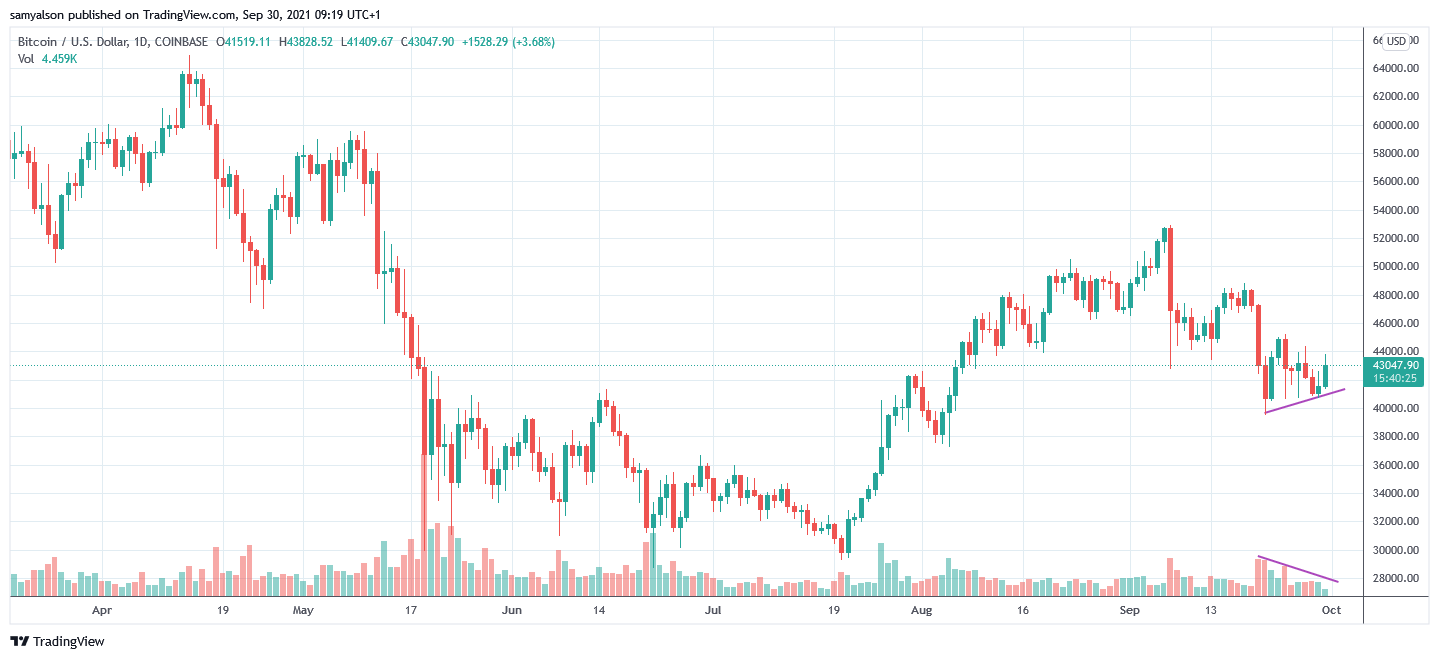
Bitcoin bottomed at $39,700 on September 21, having fallen 25% from its local high of $52,800. Since then, it’s been trading within a tight range, with $45,100 marking the high point.
Nonetheless, today, the $BTC price rallied above the $40,750 support level. And a clear break above $42,000 in the early hours (GMT) demonstrated a willingness by bulls to build on the momentum.
Typically, technical analysts see the rising prices with rising volumes as a trend confirmation. But is that what we are seeing with Rooke’s data?
“If volatility in price is accompanied by high trading volume, it may be said that the price move has more validity. Conversely, if a price move is accompanied by low trading volume, it may indicate weakness of the underlying trend.”
Is this a load of hot air?
Volume refers to every transaction between a buyer and a seller. One transaction occurs when a buyer agrees to purchase what a seller is offering. If five transactions occur in a day, the volume for that day is five.
Transaction volume is the above scenario taking into account the price of the asset at the time of exchange.
Therefore, Rooke’s data, in which transactional volume hit an all-time high, cannot be taken as a trend confirmation because that metric includes price as a variable.
What’s more, using recent transactional volume to compare past activity is somewhat erroneous in that 2021’s median price, of $46,800, is much higher than in previous years. Therefore, this skews any sort of comparison with periods when $BTC was priced much lower.
A look at the actual volume, not transactional volume, shows a downtrend over the last ten days. This was accompanied by a slight uptrend in price that has so far failed to retest previous resistance at $44,900.

Rising price with falling volume indicates a weak uptrend and a possible reversal on the cards.
Get an edge on the cryptoasset market
Access more crypto insights and context in every article as a paid member of CryptoSlate Edge.
On-chain analysis
Price snapshots
More context
Join now for $19/month Explore all benefits

Like what you see? Subscribe for updates.
Credit: Source link


 Bitcoin
  Ethereum
  XRP
XRP  Tether
  Solana
  USDC
USDC  Dogecoin
  Cardano
  Lido Staked Ether
  TRON
TRON  Wrapped Bitcoin
  Wrapped stETH
  Chainlink
  Avalanche
  Sui
Sui  Stellar
  Litecoin
  Toncoin
  Shiba Inu
  Hedera
  LEO Token
  USDS
USDS  Hyperliquid
  Polkadot
  WETH
WETH  MANTRA
  Bitcoin Cash
  Bitget Token
  Ethena USDe
  Wrapped eETH
  Uniswap
  Monero
  NEAR Protocol
  Pepe
Pepe  WhiteBIT Coin
  Aave
Aave  Ondo
Ondo  Bittensor
  Aptos
Aptos  Internet Computer
  Dai
Dai  Official Trump
  Mantle
  Ethereum Classic
  Tokenize Xchange
  OKB
OKB  Gate
Gate  sUSDS
sUSDS  Coinbase Wrapped BTC
