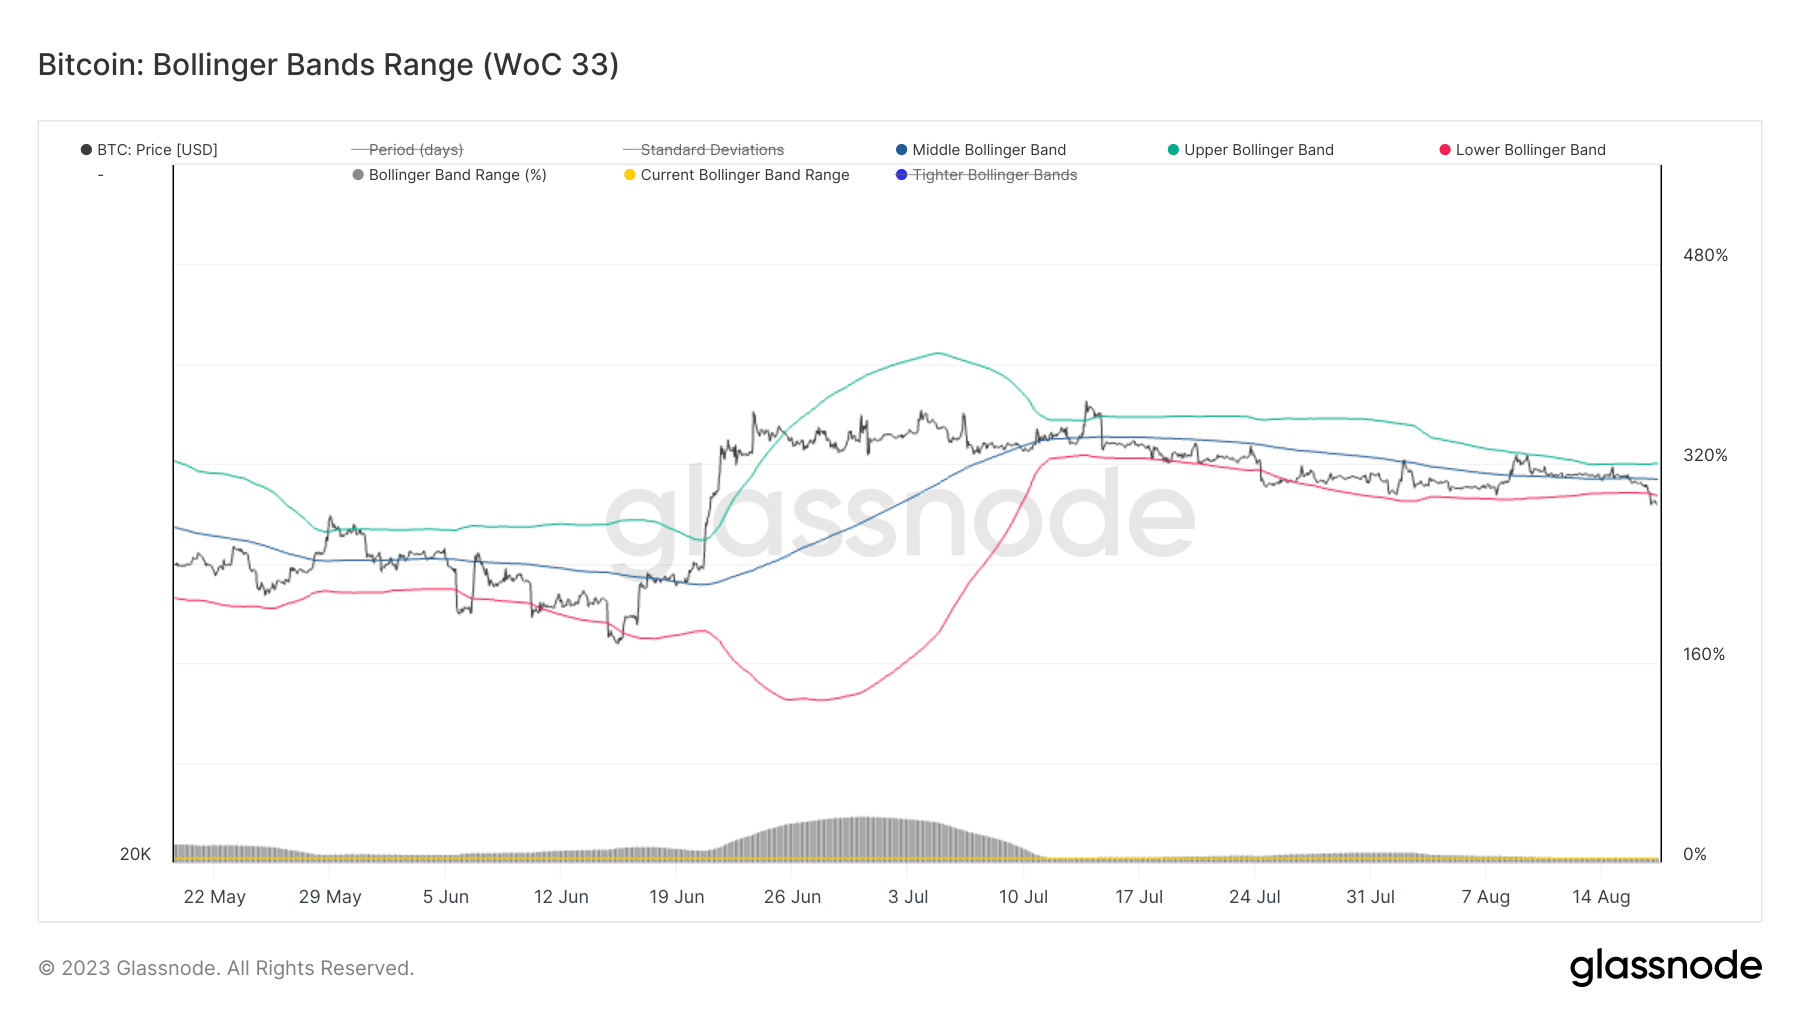
On Aug. 17, Bitcoin’s price dropped below the $29,000 mark, settling around $28,500. While this decline might seem insignificant given Bitcoin’s historically volatile nature, the context of its recent trading range magnifies the importance of this move.
Bollinger Bands are a financial tool used to assess the price volatility of various assets, including Bitcoin. The bands contain three lines — one central line and two outer ones. The central line on the chart represents the simple moving average (SMA) of the asset’s price, while the outer bands are determined by the standard deviation, a measure indicating how spread out the prices are from the average.
These bands widen during periods of high volatility and contract during low volatility. These bands are a crucial market indicator, helping traders identify potential buy and sell signals. When an asset’s price moves outside these bands, it can indicate a significant price movement in the breakout direction.
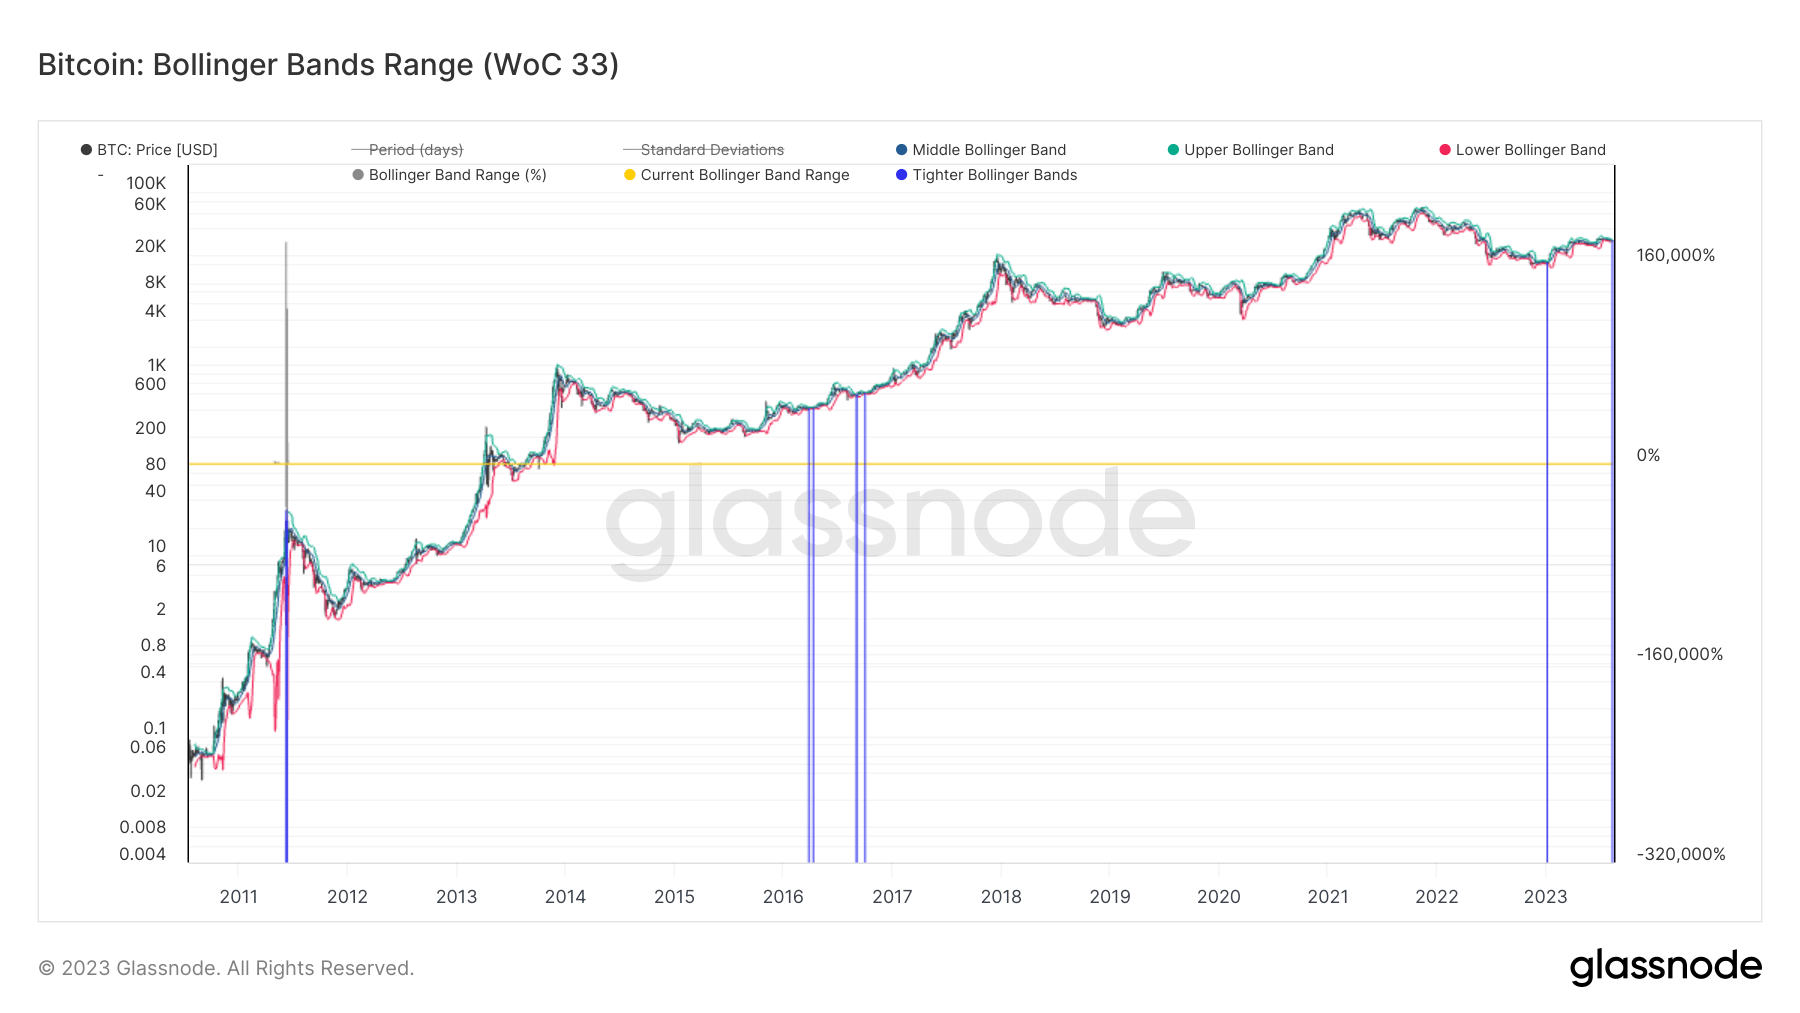
August has seen Bitcoin’s price volatility plummet to historical lows. Before today’s drop to $28,500, the upper and lower Bollinger Bands were separated by a mere 2.9%. Such a tight spread has only been witnessed twice in Bitcoin’s history. With the descent to $28,500, Bitcoin’s price breached the lower Bollinger Band, which stood at $28,794. Consequently, the Bollinger Band range expanded slightly to 3.2%.

Historical data suggests that when Bitcoin’s price breaks below the lower Bollinger Band, it is often followed by a swift recovery and an upward trajectory. This pattern has been observed multiple times, reinforcing the significance of the Bollinger Bands as a predictive tool.
Furthermore, every instance of extremely tight Bollinger Bands in Bitcoin’s history has preceded a notable price swing. For instance, several occurrences of equally tight bands were recorded in 2016. This period was the precursor to the rally that propelled Bitcoin to its all-time high in 2018. More recently, in January 2023, Bitcoin’s price remained stagnant at around $16,800, with the bands indicating low volatility. Shortly after, Bitcoin surged, nearly doubling its value to $30,000.

So, what do these observations imply for the market? The current tightness of the Bollinger Bands, combined with Bitcoin’s price movement below the lower band, suggests a potential for a significant price upswing in the near future.
The post Bitcoin at $28.5K: Unpacking the significance of tight Bollinger Bands appeared first on CryptoSlate.
Credit: Source link


 Bitcoin
  Ethereum
  XRP
XRP  Tether
  Solana
  USDC
USDC  Dogecoin
  Cardano
  Lido Staked Ether
  TRON
TRON  Wrapped Bitcoin
  Chainlink
  Wrapped stETH
  Avalanche
  Sui
Sui  Stellar
  Litecoin
  Toncoin
  Shiba Inu
  Hedera
  LEO Token
  USDS
USDS  Hyperliquid
  Polkadot
  WETH
WETH  MANTRA
  Bitcoin Cash
  Bitget Token
  Ethena USDe
  Wrapped eETH
  Uniswap
  Monero
  NEAR Protocol
  Pepe
Pepe  WhiteBIT Coin
  Aave
Aave  Bittensor
  Ondo
Ondo  Aptos
Aptos  Internet Computer
  Dai
Dai  Official Trump
  Ethereum Classic
  Mantle
  Tokenize Xchange
  OKB
OKB  Gate
Gate  sUSDS
sUSDS  Sonic (prev. FTM)
