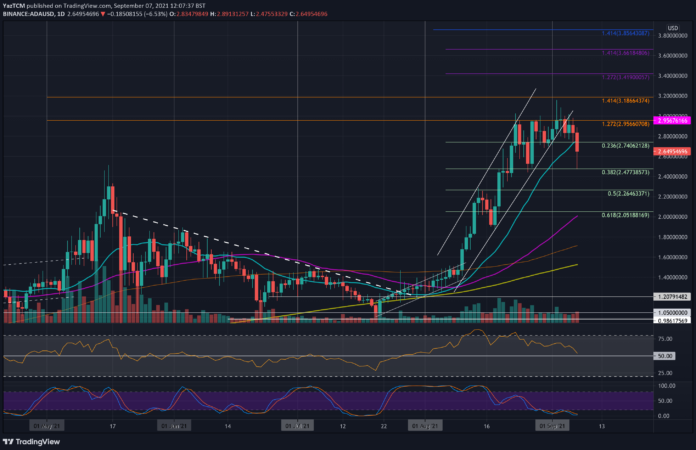
ADA/USD – ADA Spikes Lower Into .382 Fib
Key Support Levels: $2.50, $2.26, $2.00.
Key Resistance Levels: $2.76, $3.00, $3.20.
ADA has been battling the $3.00 resistance level since the end of August. The coin was trading inside an ascending price channel throughout the entire month, which allowed it to surge above the $3 level.
In September, ADA fell beneath the price channel after failing to overcome $3 after multiple attempts over the weekend. Yesterday, it fell into the support at $2.75 (20-day MA & .236 Fib). It continued to spike further lower today as it reached as low as $2.50 (.382 Fib) for a 10% daily crash.
It has bounced slightly from there as it trades above $2.60, but the recent pullback should have been expected after the market was rejected at $3 on numerous attempts.
ADA-USD Short Term Price Prediction
Looking ahead, the first support lies at $2.50 (.382 Fib). This is followed by $2.26 (.5 Fib), $2.00 (.618 Fib & 50-day MA), and $1.80 (100-day MA).
On the other side, the first resistance lies at $2.75 (20-day MA). This is followed by the resistance at $3, $3.20 (1.414 Fib Extension), $3.42 (1.272 Fib Extension), and $3.66 (1.414 Fib Extension – purple).
The RSI has been showing hidden bearish divergence over the past week and recently started to head lower, indicating that the previous bullish momentum was losing steam. It is now near the midline, which shows there is indecision within the market.
ADA/BTC – Bulls Fall Into June Highs
Key Support Levels: 5080 SAT, 4890 SAT, 4712 SAT.
Key Resistance Levels: 5550 SAT, 6000 SAT, 6200 SAT.
ADA also rolled over last week at 6000 SAT after failing to break above the resistance after multiple attempts. Yesterday, ADA dropped beneath the 20-day MA at around 5550 SAT and continued to fall beneath 5500 SAT.
Today, ADA continued to slide against BTC as it dropped as low as 4890 SAT (June 2021 high). It has since bounced from this support as it trades near 5200 SAT.
ADA-BTC Short Term Price Prediction
Moving forward, the first support lies at 5080 SAT (.382 Fib). This is followed by 4890 SAT (June high), 4712 SAT (.5 Fib), and 4500 SAT (50-day MA).
On the other side, the first resistance lies at 5550 SAT (20-day MA). This is followed by the strong resistance at 6000 SAT, 6200 SAT (1.414 Fib Extension), and 6500 SAT.
The RSI recently dipped beneath the midline, suggesting that the bears might be attempting to take control of the market momentum.
Binance Futures 50 USDT FREE Voucher: Use this link to register & get 10% off fees and 50 USDT when trading 500 USDT (limited offer).
PrimeXBT Special Offer: Use this link to register & enter POTATO50 code to get 50% free bonus on any deposit up to 1 BTC.
Disclaimer: Information found on CryptoPotato is those of writers quoted. It does not represent the opinions of CryptoPotato on whether to buy, sell, or hold any investments. You are advised to conduct your own research before making any investment decisions. Use provided information at your own risk. See Disclaimer for more information.
Cryptocurrency charts by TradingView.
Credit: Source link


 Bitcoin
  Ethereum
  Tether
  Solana
  XRP
XRP  Dogecoin
  USDC
USDC  Lido Staked Ether
  Cardano
  TRON
TRON  Avalanche
  Shiba Inu
  Wrapped stETH
  Wrapped Bitcoin
  Toncoin
  Sui
Sui  WETH
WETH  Bitcoin Cash
  Chainlink
  Pepe
Pepe  Polkadot
  LEO Token
  Stellar
  NEAR Protocol
  Litecoin
  Aptos
Aptos  Wrapped eETH
  Uniswap
  USDS
USDS  Cronos
  Hedera
  Internet Computer
  Ethereum Classic
  Bonk
Bonk  Bittensor
  Render
  Ethena USDe
  WhiteBIT Coin
  POL (ex-MATIC)
  Dai
Dai  Artificial Superintelligence Alliance
  MANTRA
  dogwifhat
  Arbitrum
  Monero
  Stacks
  OKB
OKB  Filecoin
