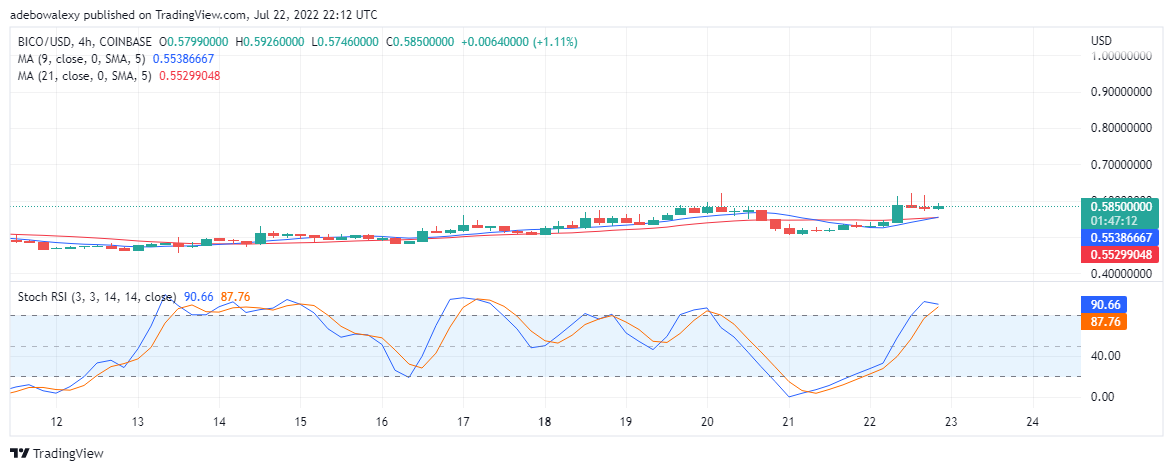
BICO displaced NEO from the top of the crypto mover list to claim the number one position. This crypto moved roughly 10% upward in value today. And, at that stands as one of the most gainful coins today. Will this coin witness more upside gain? That we’ll be answering soon.
BICO price now: 0.5816
BICO Market Cap: 751.4 million
BICO Total Supply: 100 million
BICO Rank: 61
Major Levels:
Resistance: $0.5732, $0.5780, $0.5816
Support: $0.5340, $0.5270, $0.5150
BICO/USD Value Prediction: BICO Bull Looks Tired
BICO/USD daily chart reveals signs of weakness in this crypto market. The MA (Moving Average) lines are under the price motion, however, the quicker line is attempting to cross above the last candle. The implication of this is that, once this MA line succeeds, the BICO value may have to range sideways. Consequently, this will signify a state of indecision, and traders will have to anticipate an eventual uptrend or downtrend.

Additionally, the SRSI (Stochastic Relative strength Indicator) appears to be turned sideways after a downturn. Consequently, one can expect that these indicator lines will either make an upside cross or downside cross. If these indicator lines should make an upside cross, the value of this crypto may find resistance at $0.6000, $0.6000, and $0.7000 at most. Otherwise, if these indicator lines should cross downwards, then lower supports could be found at $0.5000 and $0.4500.
BICO/USD Value Prediction: BICO Showing More Signs of Weakness
The BICO/USD 4-hour chart Portrays more signs of weakness. Here, we can see that the MA on the chart has already crossed each other, which is what gave the last bullish candle. Also, we can see the nature of this latest candle, and we can deduce from it that the bulls and bear were in a tough contest. However, eventually, the bulls narrowly won.
This indicates that the uptrend may be near its end. Other signs include the one on the SRSI, in which the lines of this indicator are about to cross each other in the overbought area. Once this happens, the indicator lines will move downwards, and the price will fall.
Battle Infinity – New Crypto Presale
- Presale Until October 2022 – 16500 BNB Hard Cap
- First Fantasy Sports Metaverse Game
- Play to Earn Utility – IBAT Token
- Powered By Unreal Engine
- CoinSniper Verified, Solid Proof Audited
- Roadmap & Whitepaper at battleinfinity.io
Credit: Source link


 Bitcoin
  Ethereum
  Tether
  Solana
  XRP
XRP  Dogecoin
  USDC
USDC  Lido Staked Ether
  Cardano
  TRON
TRON  Shiba Inu
  Avalanche
  Toncoin
  Wrapped Bitcoin
  Wrapped stETH
  Sui
Sui  Chainlink
  WETH
WETH  Bitcoin Cash
  Polkadot
  Pepe
Pepe  LEO Token
  Stellar
  NEAR Protocol
  Aptos
Aptos  Litecoin
  Wrapped eETH
  Uniswap
  USDS
USDS  Cronos
  Hedera
  Internet Computer
  Render
  Bonk
Bonk  Ethereum Classic
  MANTRA
  Bittensor
  POL (ex-MATIC)
  Ethena USDe
  WhiteBIT Coin
  Dai
Dai  Artificial Superintelligence Alliance
  dogwifhat
  Monero
  Arbitrum
  Stacks
  Filecoin
  OKB
OKB 
