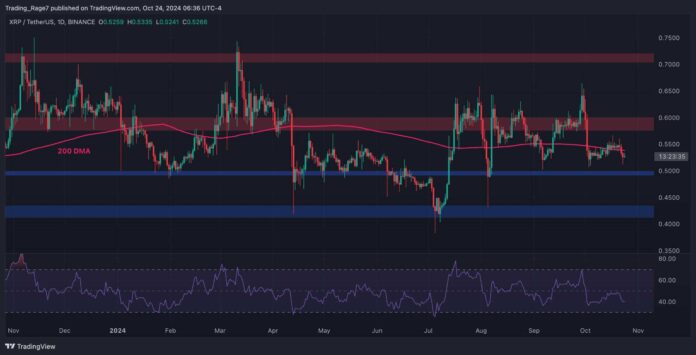
Ripple’s price has been bearish over the last few weeks as it failed to continue its upward momentum. Looking at the technical charts, more downsides are probable in the short term.
Ripple Price Analysis: Technicals
The USDT Paired Chart
By Edris Derakhshi (TradingRage)
Against USDT, the XRP price has recently crashed below the $0.6 level and the 200-day moving average, which is located around the $0.55 mark.
With the RSI also showing values below 50%, the momentum is clearly bearish. The market is likely to drop toward the $0.5 support level in the upcoming days and even lower toward the $0.43 support zone if the $0.5 level is broken.
The BTC Paired Chart
The XRP/BTC chart shows a similar behavior, as the price has dropped below the 850 SAT support level and the 200-day moving average, located around the same price mark.
Therefore, a further decline toward the 600 SAT area could be expected if the market does not climb above the 200-day moving average soon.
Meanwhile, the RSI is reaching the oversold regions, which could point to a potential bullish reversal or consolidation in the short term.
Binance Free $600 (CryptoPotato Exclusive): Use this link to register a new account and receive $600 exclusive welcome offer on Binance (full details).
LIMITED OFFER 2024 at BYDFi Exchange: Up to $2,888 welcome reward, use this link to register and open a 100 USDT-M position for free!
Disclaimer: Information found on CryptoPotato is those of writers quoted. It does not represent the opinions of CryptoPotato on whether to buy, sell, or hold any investments. You are advised to conduct your own research before making any investment decisions. Use provided information at your own risk. See Disclaimer for more information.
Cryptocurrency charts by TradingView.
Credit: Source link


 Bitcoin
  Ethereum
  Tether
  Solana
  XRP
XRP  Dogecoin
  USDC
USDC  Cardano
  Lido Staked Ether
  TRON
TRON  Avalanche
  Shiba Inu
  Toncoin
  Wrapped stETH
  Wrapped Bitcoin
  Stellar
  Polkadot
  Chainlink
  Bitcoin Cash
  Sui
Sui  WETH
WETH  Pepe
Pepe  LEO Token
  Litecoin
  NEAR Protocol
  Aptos
Aptos  Uniswap
  Wrapped eETH
  Hedera
  Internet Computer
  USDS
USDS  Cronos
  Ethereum Classic
  POL (ex-MATIC)
  Render
  Bittensor
  Bonk
Bonk  Ethena USDe
  WhiteBIT Coin
  MANTRA
  Artificial Superintelligence Alliance
  Dai
Dai  dogwifhat
  Arbitrum
  Filecoin
  Stacks
  OKB
OKB 
