Amidst widespread bullish sentiment surrounding Bitcoin, one analyst on X thinks the leg up won’t be as strong as it was in the past few weeks. Pointing to developments in the Bitcoin log curves, the analyst expects the coin to find resistance as it attempts to break higher.
Bitcoin Uptrend To Slow Down
The analyst doubts the current excitement around the uptrend, and technical formations advise the contrarian view. Many in the industry think Bitcoin will not only ease past $70,000, a round number nearly tested this week, but also float to $100,000 in the next few weeks.
On X, the analyst remains confident about the coin’s prospects. However, based on the Bitcoin log curve assessment, the leg up will likely be labored. The analyst compares the current price formations with the Bitcoin log curves. In 2021, the tool was used to identify price peaks.
Based on price formation, the analyst notes that if BTC peaks in 2024, then prices will likely turn around from between $77,000 and $149,000. These prospective peaks’ upper and lower bands represent layers 5 and 7 of the log curve.
Even with BTC possibly rising to $149,000, at least from the tool, the Layer 7 target is relatively lower. By factoring in a one-year slowdown in growth, the predicted peak is revised downwards from $180,000 to $149,000.
When writing, the “red band” of the log curve has been breached earlier than usual. Looking back, Bitcoin prices tend to peak three months after this breakout.
That likely places Bitcoin’s peak at around the $77,000 level but below $100,000. Nonetheless, this is hard to predict, considering the volatile nature of prices and the dynamic nature of fundamental factors.
The community remains optimistic about what lies ahead. So far, Bitcoin prices have been trending at historical highs, but there has been a sharp drop in the momentum of upside.
BTC Bears In A Commanding Position
The daily chart shows that prices are still inside the bear bar of March 5. The candlestick had a high trading volume and was wide-ranging. For the uptrend to be valid, prices must break above $70,000, based on rising trading volume.

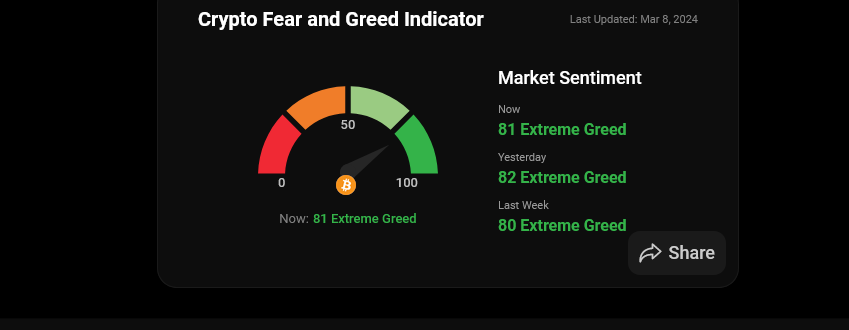
Lower prices incentivize issuers to spot Bitcoin exchange-traded funds (ETFs) to load up on dips. Their actions have spurred demand over the past few weeks, lifting sentiment and prices. According to Coinstats’ Fear and Greed Index, “extreme greed” exists in the market.
Feature image from DALLE, chart from TradingView
Disclaimer: The article is provided for educational purposes only. It does not represent the opinions of NewsBTC on whether to buy, sell or hold any investments and naturally investing carries risks. You are advised to conduct your own research before making any investment decisions. Use information provided on this website entirely at your own risk.
Credit: Source link


 Bitcoin
  Ethereum
  Tether
  Solana
  XRP
XRP  Dogecoin
  USDC
USDC  Lido Staked Ether
  Cardano
  TRON
TRON  Avalanche
  Shiba Inu
  Wrapped stETH
  Wrapped Bitcoin
  Toncoin
  Sui
Sui  WETH
WETH  Bitcoin Cash
  Chainlink
  Pepe
Pepe  Polkadot
  LEO Token
  Stellar
  NEAR Protocol
  Litecoin
  Aptos
Aptos  Wrapped eETH
  Uniswap
  USDS
USDS  Cronos
  Hedera
  Internet Computer
  Ethereum Classic
  Bonk
Bonk  Bittensor
  Render
  Ethena USDe
  POL (ex-MATIC)
  WhiteBIT Coin
  Dai
Dai  MANTRA
  Artificial Superintelligence Alliance
  Arbitrum
  dogwifhat
  Monero
  Stacks
  OKB
OKB  Filecoin
