Join Our Telegram channel to stay up to date on breaking news coverage
The Ankr price prediction begins a decent recovery wave above $0.026 as the coin approaches a major hurdle near $0.028.
Ankr Prediction Statistics Data:
- Ankr price now – $0.026
- Ankr market cap – $257 million
- Ankr circulating supply – 10 billion
- Ankr total supply – 10 billion
- Ankr CoinMarketCap ranking – #148
ANKR/USD Market
Key Levels:
Resistance levels: $0.030, $0.032, $0.034
Support levels: $0.021, $0.019, $0.017
ANKR/USD is in the hands of the bulls as the coin crosses above the 9-day and 21-day moving averages. However, according to the daily chart, the bulls may need to gather enough energy to push the coin above the upper boundary of the channel. The technical indicator the 9-day MA is likely to cross above the 21-day MA, suggesting bullish movement.
Ankr Price Prediction: Ankr May Spike to the Upside
Looking at the daily chart, the Ankr price is ready to break into the upside if the bulls increase the buying pressure. However, the more the bulls pressurized the bears, the higher the coin would reach. Therefore, if the bulls maintain the upward trend, ANKR/USD may continue with the bullish movement which could take the coin to the resistance levels of $0.030, $0.032, and $0.034.
On the other hand, any strong selling pressure may resume in the market and this could drag the price below the moving averages. Should BTC trade below the daily opening price of $0.024, a bearish movement could take the price to the support levels at $0.021, $0.019, and $0.017.
ANKR/BTC Spikes to the Upside
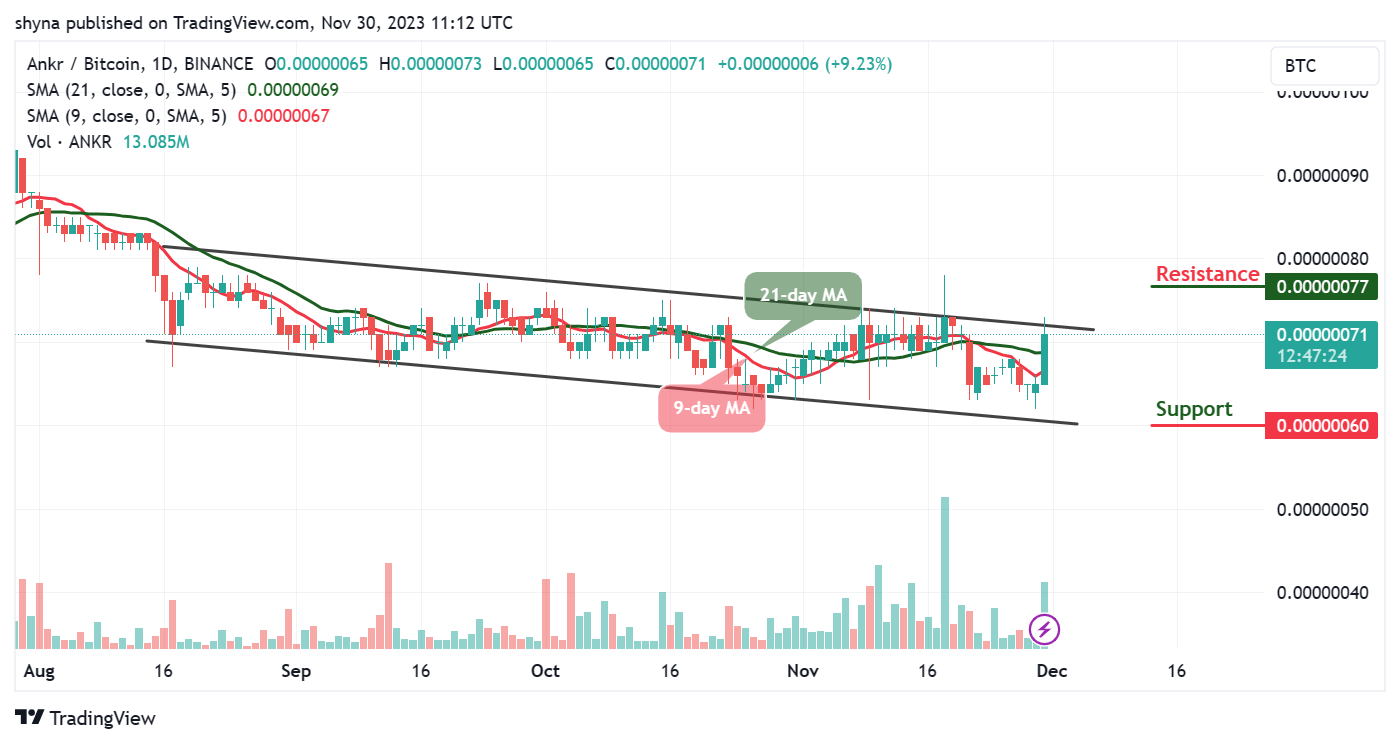
Against Bitcoin, the Ankr price is hovering above the 9-day and 21-day moving averages as the bulls increase their entries within the market. At the time of writing, the Ankr price has not been able to push the price above the upper boundary of the channel as it is currently trading at 71 SAT. If the Ankr signals a bullish rally, it may likely meet resistance at 77 SAT and above.

Looking at the daily chart, traders can see that the market may maintain the bullish movement as the 9-day MA could move to cross above the 21-day MA. Meanwhile, any bearish movement below the lower boundary of the channel could hit the support at 60 SAT and below.
Alternatives to Ankr
According to the daily chart, the Ankr price is hovering around $0.026 with a tremendous bullish movement toward the upper boundary of the channel. However, if the bulls put more pressure, the resistance level of $0.028 could be reached above the channel. Therefore, if the 9-day MA crosses above the 21-day MA, this could increase the bullish movement within the channel.
However, Ankr (ANKR) boasts stability with a $257.1 million market cap but may have limited short-term growth. In contrast, Bitcoin Minetrix, raising over $4.5 million in its initial coin offering, presents an opportunity for significant rapid gains with its lower market cap. Therefore, investors are encouraged to diversify their portfolios, considering the potential growth offered by Bitcoin Minetrix alongside the Ankr stability.
New Crypto Mining Platform – Bitcoin Minetrix
- Audited By Coinsult
- Decentralized, Secure Cloud Mining
- Earn Free Bitcoin Daily
- Native Token On Presale Now – BTCMTX
- Staking Rewards – Over 100% APY
Join Our Telegram channel to stay up to date on breaking news coverage
Credit: Source link


 Bitcoin
  Ethereum
  Tether
  Solana
  XRP
XRP  Dogecoin
  USDC
USDC  Cardano
  Lido Staked Ether
  TRON
TRON  Avalanche
  Toncoin
  Shiba Inu
  Wrapped stETH
  Stellar
  Wrapped Bitcoin
  Polkadot
  Chainlink
  Bitcoin Cash
  WETH
WETH  Sui
Sui  Pepe
Pepe  LEO Token
  NEAR Protocol
  Litecoin
  Aptos
Aptos  Uniswap
  Wrapped eETH
  Hedera
  USDS
USDS  Internet Computer
  Cronos
  POL (ex-MATIC)
  Ethereum Classic
  Ethena USDe
  Artificial Superintelligence Alliance
  Render
  Bittensor
  WhiteBIT Coin
  Dai
Dai  Bonk
Bonk  Arbitrum
  MANTRA
  Celestia
  Filecoin
  Cosmos Hub
  OKB
OKB 
