Join Our Telegram channel to stay up to date on breaking news coverage
The Polkadot price prediction reveals that DOT records a gain of 2.78%, as the coin approaches the $5.00 resistance level.
Polkadot Prediction Statistics Data:
- Polkadot price now – $4.44
- Polkadot market cap – $5.75 billion
- Polkadot circulating supply – 1.30 billion
- Polkadot total supply – 1.37 billion
- Polkadot Coinmarketcap ranking – #14
DOT/USD Market
Key Levels:
Resistance levels: $5.00, $5.20, $5.40
Support levels: $3.80, $3.60, $3.40
DOT/USD is trading above the 9-day and 21-day moving averages with a gain of 2.78%. According to the daily chart, the previous candle formations have been respecting upward movement but crossing below the moving averages may position the market price in a decline. Meanwhile, the closest support level is located at the $4.23 level while a north wave might see a high movement above the upper boundary of the channel.
Polkadot Price Prediction: Polkadot Price May Head to the North
The Polkadot price is heading toward the upside, an increase above the channel could trigger intense buying to the resistance levels of $5.00, $5.20, and $5.40. On the contrary, the Polkadot price may need to hold the support level at $4.23 which is the current daily low. But, if the Polkadot price drops below this support level, it may likely hit another support at $4.00.
Meanwhile, if the selling volume steps into the market, it could dip to the support levels of $3.80, $3.60, and $3.40. Moreover, the 9-day moving average is above the 21-day moving average which reveals that the market could face the north.
DOT/BTC Begins the Bullish Movement
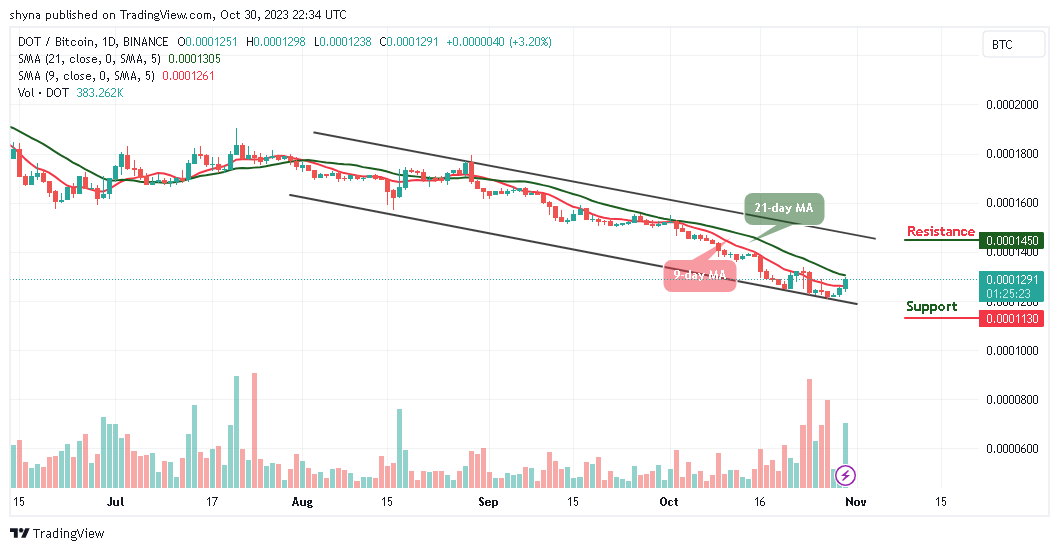
Against Bitcoin, the Polkadot price is likely to cross above the 21-day moving average to continue the bullish movement within the channel. From the upside, the potential resistance level could be located at 1450 SAT and above as bulls dominate the market.

However, looking at the downside; the nearest level of support could be found at 1200 SAT, if the price drops further to create a new low, lower support could be found at 1130 SAT and below. Meanwhile, the 9-day MA is likely to cross above the 21-day MA, which means that the market may begin to follow the upward movement.
Alternatives to Polkadot
The Polkadot price has been facing the upside since the beginning of the European session, the coin is hovering above the 9-day and 21-day moving averages which could touch another resistance level of $4.80. However, DOT/USD may cross above the upper boundary of the channel if the buyers increase the buying pressure.
Nevertheless, $BTCMTX has the solution you’ve been eagerly anticipating and this could be done by obtaining and staking BTCMTX tokens. However, investors can gain access to cloud mining credits as this decentralized method prioritizes the security and transparency of your investments. Meanwhile, the ongoing presale has already raised more than $2.80 million, so investors are encouraged to buy the token now.
New Crypto Mining Platform – Bitcoin Minetrix
- Audited By Coinsult
- Decentralized, Secure Cloud Mining
- Earn Free Bitcoin Daily
- Native Token On Presale Now – BTCMTX
- Staking Rewards – Over 100% APY
Join Our Telegram channel to stay up to date on breaking news coverage
Credit: Source link


 Bitcoin
  Ethereum
  Tether
  Solana
  XRP
XRP  Dogecoin
  USDC
USDC  Lido Staked Ether
  Cardano
  TRON
TRON  Avalanche
  Shiba Inu
  Wrapped stETH
  Wrapped Bitcoin
  Toncoin
  Sui
Sui  WETH
WETH  Bitcoin Cash
  Chainlink
  Pepe
Pepe  Polkadot
  LEO Token
  Stellar
  NEAR Protocol
  Litecoin
  Aptos
Aptos  Wrapped eETH
  Uniswap
  USDS
USDS  Cronos
  Hedera
  Internet Computer
  Ethereum Classic
  Bonk
Bonk  Bittensor
  Render
  Ethena USDe
  POL (ex-MATIC)
  WhiteBIT Coin
  Dai
Dai  MANTRA
  Artificial Superintelligence Alliance
  Arbitrum
  dogwifhat
  Monero
  Stacks
  OKB
OKB  Filecoin