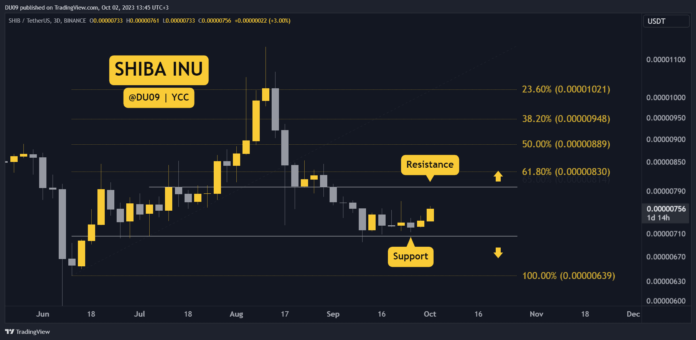
Shiba’s price has been making steady gains and the momentum appears to be shifting in bulls favor.
Key Support levels: $0.0000070
Key Resistance levels: $0.0000080, $0.0000083
1. The Start of a Rally?
With Bitcoin above $28k, altcoins are starting to move and SHIB is no different. The current chart shows a clear bullish momentum which could take the price to the key resistance at $0.0000080. Considering that Shiba Inu is a momentum coin, reaching that target appears easy so long the uptrend stays intact.
2. Volume is Still Flat
While the price action and momentum are bullish, there is one thing missing right now: volume. The buy pressure is relatively flat with no significant increase to date. However, if the current trend maintains, then buyers should return to SHIB and test the key levels ahead.
3. Momentum Indicators Turning Bullish
The 3-day RSI is making higher lows and has curved up nicely over the past few days. This is a bullish signal that will be confirmed once the RSI passes the 50 points level. The 3-day MACD is also curving up and will do a bullish cross soon if this momentum continues.
Bias
The bias for SHIB is bullish.
Short-Term Prediction for SHIB Price
This meme coin found good support at $0.0000070 and the price moved higher ever since. The current targets are found at $0.0000080 and $0.0000083. They will also act as a resistance to the uptrend. Watch closely those levels in the next few days.
Binance Free $100 (Exclusive): Use this link to register and receive $100 free and 10% off fees on Binance Futures first month (terms).
PrimeXBT Special Offer: Use this link to register & enter CRYPTOPOTATO50 code to receive up to $7,000 on your deposits.
Disclaimer: Information found on CryptoPotato is those of writers quoted. It does not represent the opinions of CryptoPotato on whether to buy, sell, or hold any investments. You are advised to conduct your own research before making any investment decisions. Use provided information at your own risk. See Disclaimer for more information.
Cryptocurrency charts by TradingView.
Credit: Source link


 Bitcoin
  Ethereum
  Tether
  Solana
  XRP
XRP  Dogecoin
  USDC
USDC  Lido Staked Ether
  Cardano
  TRON
TRON  Shiba Inu
  Avalanche
  Toncoin
  Wrapped Bitcoin
  Wrapped stETH
  Sui
Sui  Chainlink
  WETH
WETH  Bitcoin Cash
  Pepe
Pepe  Polkadot
  LEO Token
  Stellar
  NEAR Protocol
  Litecoin
  Aptos
Aptos  Uniswap
  Wrapped eETH
  USDS
USDS  Hedera
  Cronos
  Internet Computer
  Bonk
Bonk  Render
  Ethereum Classic
  MANTRA
  Bittensor
  POL (ex-MATIC)
  dogwifhat
  Dai
Dai  Ethena USDe
  Artificial Superintelligence Alliance
  WhiteBIT Coin
  Monero
  Stacks
  Arbitrum
  OKB
OKB 
