Join Our Telegram channel to stay up to date on breaking news coverage
The Compound price prediction is struggling to trade near the resistance level of $40 as the coin retreats below the moving averages.
Compound Prediction Statistics Data:
- Compound price now – $39.49
- Compound market cap – $314.6 million
- Compound circulating supply – 7.8 million
- Compound total supply – 10 million
- Compound Coinmarketcap ranking – #59
COMP /USD Market
Key Levels:
Resistance levels: $55, $60, $65
Support levels: $25, $20, $15
COMP/USD opens today’s trade with the opening price of $39.56, during the European session; the coin may drop to the support level of $38. At the time of writing, the Compound price is changing hands at $39.49, slightly down by 0.29% after a rebound from the $39.25 level. At the moment, the daily chart reveals that the technical indicator Relative Strength Index (14) is hovering below the 50-level, which means the coin could be vulnerable to further losses.
Compound Price Prediction: Will COMP see a Further Downside?
According to the daily chart, if the sellers bring the Compound price beneath the daily low at $39.25, the next support level could head toward the lower boundary of the channel and a further downside may come to play out within the market in the negative moves.
Moreover, if the $38 support breaks, further support levels could be located at $25, $20, and $15 while the resistance levels could be found at $55, $60, and $65 in case the Compound price crosses above the channel. However, the technical indicator Relative Strength Index (14) could slide below the 40-level, if the market successfully gains more downsides, the increased bearish pressure could drive the Compound price toward the lower boundary of the channel.
COMP/BTC Could Range-bounds
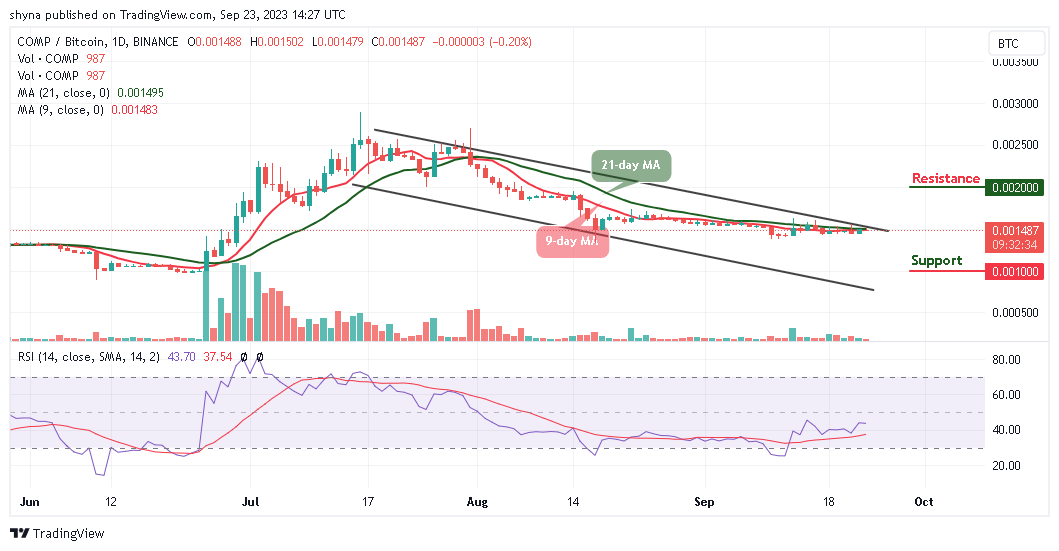
Against Bitcoin, traders can see that the Compound price may follow a bullish movement. However, if the price crosses above the upper boundary of the channel, it could reach the resistance level of 1500 SAT where the nearest target is located. Meanwhile, the continuation of the uptrend could hit the main resistance level at 2000 SAT and above.

Nevertheless, if the sellers bring the coin below the 9-day and 21-day moving averages, it could reach critical support at 1000 SAT and below. However, the Relative Strength Index (14) is now moving in the same direction, indicating sideways movement.
Alternatives to Compound
The daily chart reveals that the Compound price could move bullishly, but the Relative Strength Index (14) lines foretell that the coin could follow a sideway movement. It reveals that the trend is at its terminal, moving below the 50-level, which implies that the strength of the trend is at its end.
However, the Wall Street Memes token has reached its conclusive stage, granting investors the opportunity to acquire it at the current presale price before it becomes available on exchanges. Meanwhile, it has already raised over $25 million in its presale as it anticipates its official launch in the coming days.
Ends Soon – Wall Street Memes
- Early Access Presale Live Now
- Established Community of Stocks & Crypto Traders
- Featured on Cointelegraph, CoinMarketCap, Yahoo Finance
- Rated Best Crypto to Buy Now In Meme Coin Sector
- Team Behind OpenSea NFT Collection – Wall St Bulls
- Tier One Exchange Listings September 27
- Tweets Replied to by Elon Musk
Join Our Telegram channel to stay up to date on breaking news coverage
Credit: Source link


 Bitcoin
  Ethereum
  Tether
  Solana
  XRP
XRP  Dogecoin
  USDC
USDC  Lido Staked Ether
  Cardano
  TRON
TRON  Avalanche
  Shiba Inu
  Wrapped Bitcoin
  Wrapped stETH
  Toncoin
  Sui
Sui  Bitcoin Cash
  WETH
WETH  Chainlink
  Polkadot
  Stellar
  Pepe
Pepe  LEO Token
  NEAR Protocol
  Litecoin
  Aptos
Aptos  Wrapped eETH
  Uniswap
  USDS
USDS  Cronos
  Hedera
  Internet Computer
  Ethereum Classic
  Bonk
Bonk  Render
  Bittensor
  Ethena USDe
  POL (ex-MATIC)
  WhiteBIT Coin
  MANTRA
  Dai
Dai  Artificial Superintelligence Alliance
  dogwifhat
  Arbitrum
  Monero
  Stacks
  Filecoin
  OKB
OKB 
