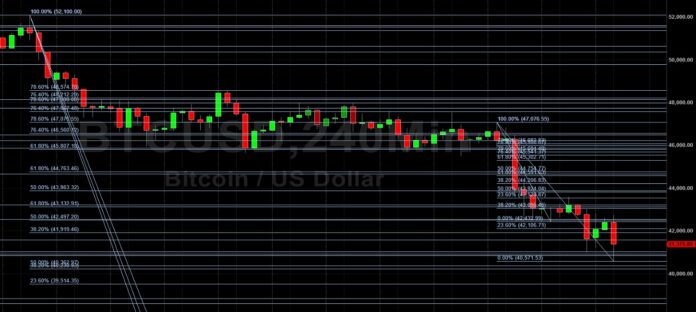
Bitcoin (BTC/USD) extended its recent weakness early in today’s Asian session as the pair weakened to the 40571.53 figure following recent strong selling pressure that intensified late last year, resulting in the weakest print since September 2020. Additional selling pressure emerged late this week around the 43594.12 level, representing a test of the 23.6% retracement of the recent depreciating range from 47076.55 to 42432.99. Following BTC/USD’s peak around the 52100 level in late December, a series of lower highs and lower lows led to a significant reduction in risk tolerance and selling pressure increased around the 48574 and 47076 areas. A print around the 42432.99 level represented a test of the 42544.70 area, a downside price objective related to recent selling pressure around the 59249.77 area, and a test of the 42497.20 downside price objective that is related to recent selling pressure around the 52100 level.
Stops were recently elected below a series of downside price objectives including the 46219.09, 45864.66, 45807.18, 44655.08, 44763.46, 43863.32, 43211.49, 43132.91, 42544.70, 42497.20, 41919.46, and 41583.39 levels. If BTC/USD extends its recent depreciation, additional downside price objectives include the 40362, 40230, 39514, 38832, 38602, 37782, 37593, 37426, 37119, and 35626 levels. Traders are observing that the 50-bar MA (4-hourly) is bearishly indicating below the 100-bar MA (4-hourly) and below the 200-bar MA (4-hourly). Also, the 50-bar MA (hourly) is bearishly indicating below the 100-bar MA (hourly) and below the 200-bar MA (hourly).
Price activity is nearest the 50-bar MA (4-hourly) at 45942.81 and the 50-bar MA (Hourly) at 43260.28.
Technical Support is expected around 39514.35/ 38670.39/ 35734.12 with Stops expected below.
Technical Resistance is expected around 53046.01/ 55157.38/ 55526.67 with Stops expected above.
On 4-Hourly chart, SlowK is Bullishly above SlowD while MACD is Bearishly below MACDAverage.
On 60-minute chart, SlowK is Bullishly above SlowD while MACD is Bearishly below MACDAverage.
Disclaimer: This trading analysis is provided by a third party, and for informational purposes only. It does not reflect the views of Crypto Daily, nor is it intended to be used as legal, tax, investment, or financial advice.
Credit: Source link


![Pepe Coin [PEPE] Post-Halving Price Prediction](https://news.coinspectra.com/wp-content/uploads/2024/03/pepe-coin-1-218x150.jpg)


 Bitcoin
  Ethereum
  Tether
  Solana
  XRP
XRP  Dogecoin
  USDC
USDC  Cardano
  Lido Staked Ether
  TRON
TRON  Avalanche
  Stellar
  Toncoin
  Shiba Inu
  Wrapped stETH
  Wrapped Bitcoin
  Polkadot
  Chainlink
  Bitcoin Cash
  WETH
WETH  Sui
Sui  Pepe
Pepe  LEO Token
  NEAR Protocol
  Litecoin
  Aptos
Aptos  Uniswap
  Wrapped eETH
  Hedera
  Internet Computer
  USDS
USDS  Cronos
  POL (ex-MATIC)
  Ethereum Classic
  Render
  Ethena USDe
  Bittensor
  Artificial Superintelligence Alliance
  WhiteBIT Coin
  Dai
Dai  Arbitrum
  Cosmos Hub
  Bonk
Bonk  Filecoin
  MANTRA
  OKB
OKB  dogwifhat
