Since Bitcoin’s inception, network difficulty has grown from 1 to as much as 48.71 trillion hashes that a miner would theoretically need to generate to find the winning one. This means it is 48.71 trillion times harder to mine a Bitcoin block today than when mining first began in 2009 — a compound increase of 20.64% per month.
At the time of this writing, Bitcoin’s difficulty is at an all-time high, which means that miners — on a BTC basis — are making less in rewards per unit of hash rate than ever before. Next to bitcoin’s price, Bitcoin’s difficulty is a primary factor that influences hash price (mining revenue per unit of hash rate), so miners are interested in projecting Bitcoin’s hash rate growth and difficulty trends for business planning.
To this end, miners and Bitcoiners devised the constant-block-time method for estimating upcoming adjustments, but this method typically over or under estimates difficulty changes at the beginning of each difficulty epoch.
To improve on this, the team at Luxor Technologies developed a new method called the “rolling-block method,” which we describe in more detail in a recent report on forecasting Bitcoin mining difficulty.
It’s our hope that the rolling-block method for forecasting Bitcoin difficulty could provide miners, investors and hash rate traders a better tool to plan for difficulty changes
Luxor’s ‘Rolling Block Method’ For Forecasting Difficulty Adjustments
For this report, we developed a new time series forecasting method for upcoming difficulty adjustments, which improves accuracy at the beginning of the epoch compared to the constant block time method. We call this the succinctly-named “rolling-2,015-block, square-root-weighted, epoch-adjusted block time method” (or just “rolling-block method,” “adjusted-block-time method,” or “dual-epoch method”).
This new method improves upon the constant-block-time method early in the epoch by including block times from the previous 2,015 blocks, instead of just the blocks from the current epoch, which can skew forecasts early in the epoch for lack of data points. To account for the change in network difficulty between epochs, block times in the previous epoch are adjusted by the previous adjustment. And finally, we weight the average block times of the current epoch with the square of the proportion through the epoch. This final step is to diminish the impact of block times from the previous epoch as the current epoch progresses since these values do not actually determine the upcoming adjustment.
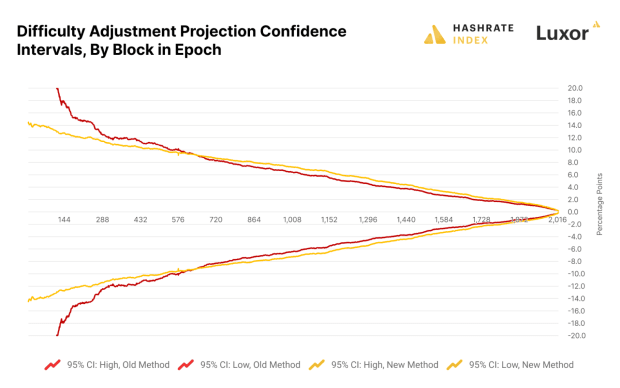
In the chart below, we can see through confidence intervals that the new method performed better than the old model at the beginning of the epoch up to block 650, but it performed slightly more poorly thereafter:

This forecast, of course, is only for projecting the next difficulty adjustment. What if we wanted to forecast, say, a year into the future?
Long-Term Bitcoin Mining Difficulty Forecasting
Luxor has developed models for long-term difficulty forecasting, as well, but these models are obviously much more complex, since they span a longer time frame.
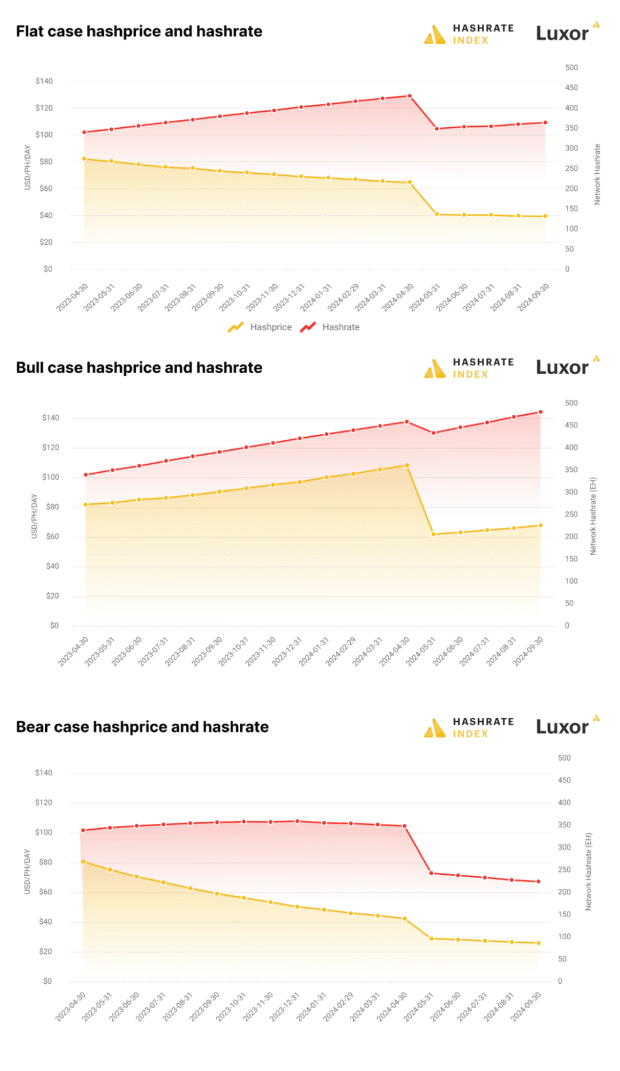
Our model takes the bitcoin price, transaction fees and block subsidy as inputs on the demand side, and internal data on ASIC production estimates and operating cost distributions across the industry on the supply side. Using these inputs, the model produces an equilibrium hash rate, difficulty and hash price for 18-month periods.
The model structure reflects reality; hash rate, difficulty and hash price are endogenous to the system, not exogenous determinants of one another. We can conduct sensitivity analyses with the model across all inputs as well. For example, we can forecast an equilibrium hash rate, difficulty, and hash price across a range of bitcoin prices.
The charts below present projections from our updated hash rate supply and demand model. It provides estimates for flat, bull and bear bitcoin price scenarios.

Hash Rate, Difficulty And Hash Price Projection Updates
Hash rate is an emerging asset class and digital commodity market. Hash rate market participants like Bitcoin miners, hosters, lenders, investors and traders need access to the rigorous economic analysis and data available in other commodity markets.
Luxor will be committed to providing this analysis and forecasting on a quarterly basis. If you’d like to learn more, please visit this post.
This is a guest post by Colin Harper. Opinions expressed are entirely their own and do not necessarily reflect those of BTC Inc or Bitcoin Magazine.
Credit: Source link


 Bitcoin
  Ethereum
  Tether
  Solana
  XRP
XRP  Dogecoin
  USDC
USDC  Lido Staked Ether
  Cardano
  TRON
TRON  Avalanche
  Shiba Inu
  Wrapped stETH
  Wrapped Bitcoin
  Toncoin
  Sui
Sui  WETH
WETH  Bitcoin Cash
  Chainlink
  Pepe
Pepe  Polkadot
  LEO Token
  Stellar
  NEAR Protocol
  Litecoin
  Aptos
Aptos  Wrapped eETH
  Uniswap
  USDS
USDS  Cronos
  Hedera
  Internet Computer
  Ethereum Classic
  Bonk
Bonk  Bittensor
  Render
  Ethena USDe
  WhiteBIT Coin
  POL (ex-MATIC)
  Dai
Dai  Artificial Superintelligence Alliance
  MANTRA
  Arbitrum
  dogwifhat
  Monero
  Stacks
  OKB
OKB  Filecoin
