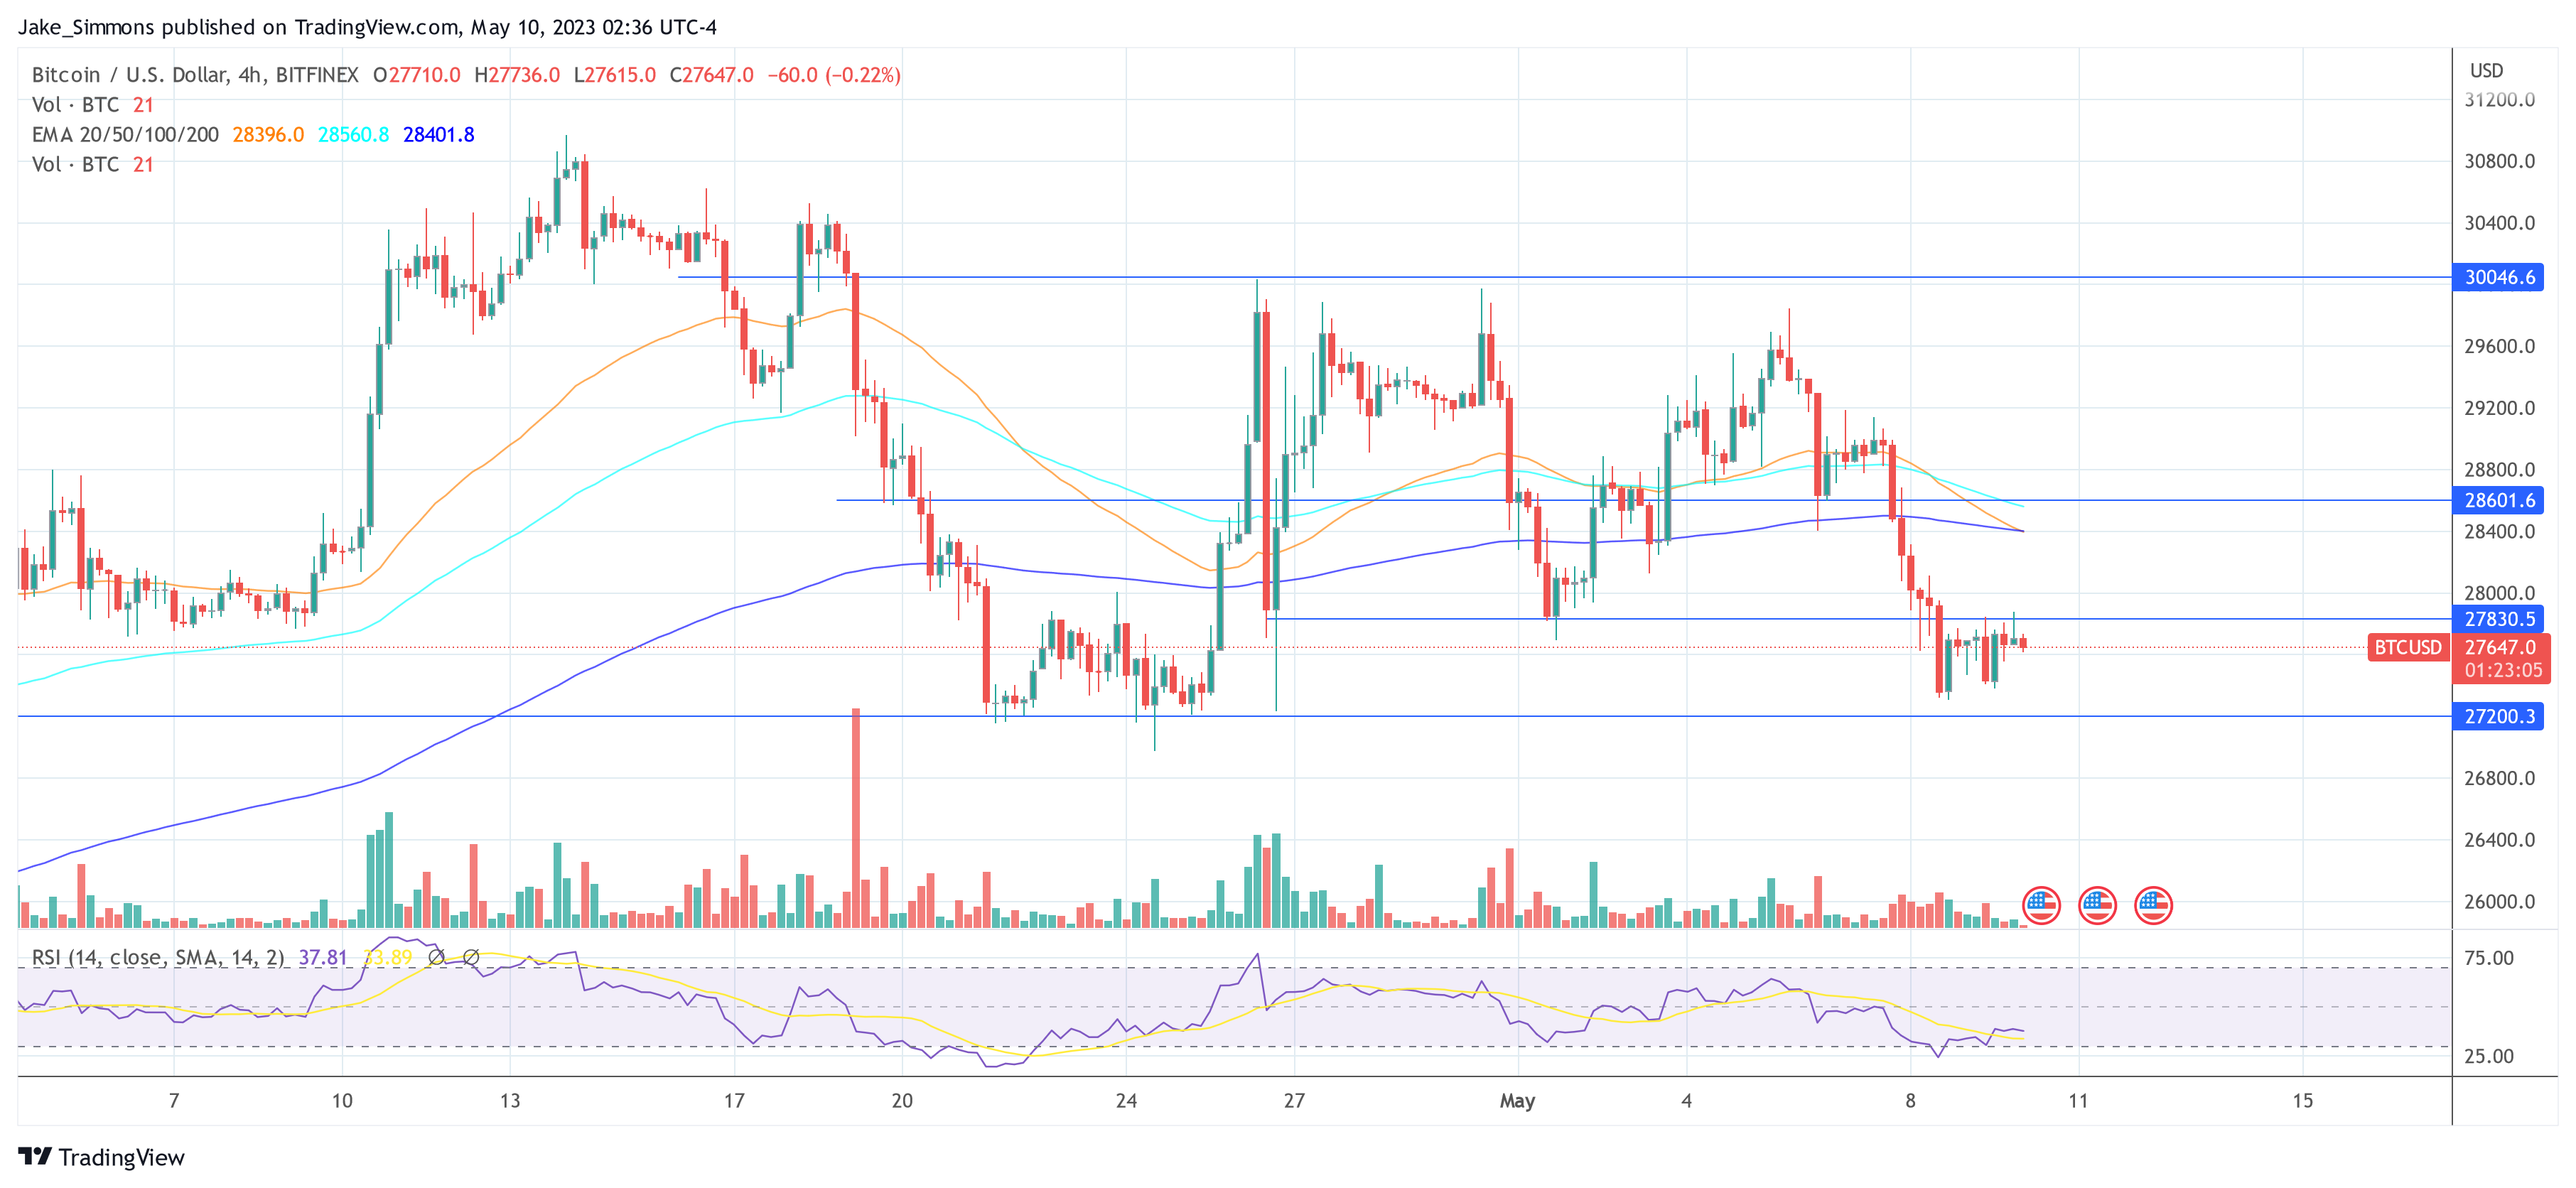
The Bitcoin price has failed to break above the key resistance level of $27,800 since Monday. With today’s release of the US Consumer Price Index (CPI), a directional decision may be imminent: Will Bitcoin climb again towards $30,000 or is a drop to $25,000 looming?
Who Will Buckle First?
The Consumer Price Index (CPI) will be announced an hour (8:30 am EST) before the US trading session opens. Headline inflation on an annual basis (YoY) is expected to be unchanged at 5.0% (vs. 5.0% last time). The core rate is expected to fall slightly, from 5.6% to 5.5%. On a monthly basis, headline CPI is expected at 0.4% vs. 0.1% last and the core rate at 0.3% vs. 0.4% last.
Today’s CPI release could be of major importance because there is a significant discrepancy between the US Federal Reserve (Fed) and market expectations. According to the dot plot and Jerome Powell, there are no rate cuts scheduled this year, while according to the CME FedWatch tool, the market is calling a bluff and the majority is forecasting two to three rate cuts.
One side will have to buckle prematurely, and if the CPI numbers come in worse than expected, it could be the market. As a result, it can be expected that the stock market will plummet and possibly drag Bitcoin down as well. A positive surprise in today’s CPI numbers is therefore highly significant for the market.
Remarkably, Goldman Sachs expects core CPI to rise by 0.47% in April, above the consensus of 0.3%. This would also put the annual rate at 5.59%, above consensus of 5.5%. The banking giant also predicts headline CPI to rise to 0.50% (vs. 0.4%), which would lift the annual rate to 5.09% (vs. 5.0%).
Bitcoin Ahead Of CPI
Ahead of the CPI release, the Bitcoin price is stuck in a tricky situation. The bears are starting to feel in control, but the bulls continue to have the upper hand in the higher time frames.
As analyst @52skew notes, there are signs that the Bitcoin perpetuals market is oversaturated with short positions. While the Bitcoin Perp CVD Buckets & Delta Orders show some liquidation of short positions, they still show heavy short positioning on upswings. This is “often defined as short control,” the analyst said. Binance spot is the market selling aggressor today.
$BTC Spot CVD Buckets & Delta Orders
Still very much the same, daily vwap illustrates when MMs are twap selling into price via small spot orders / MM spot orders & TWAP CVD / MM CVDBounces still being sold by MMs.
Binance spot is the market selling aggressor today https://t.co/k02hc5qCDL pic.twitter.com/hwVw1YJcqm
— Skew Δ (@52kskew) May 10, 2023
On the other hand, an old ‘reversion indicator’ of 2019 is just flashing up: Bitmex trading below spot. As on-chain analysis service Santiment also observes, Bitcoin’s funding rate on BitMEX is showing its most negative ratio since the massive bets against prices in mid-March, just before prices spiked.
“Generally, price rise probabilities increase when the crowd overwhelmingly assumes prices will be dropping,” Santiment concludes.
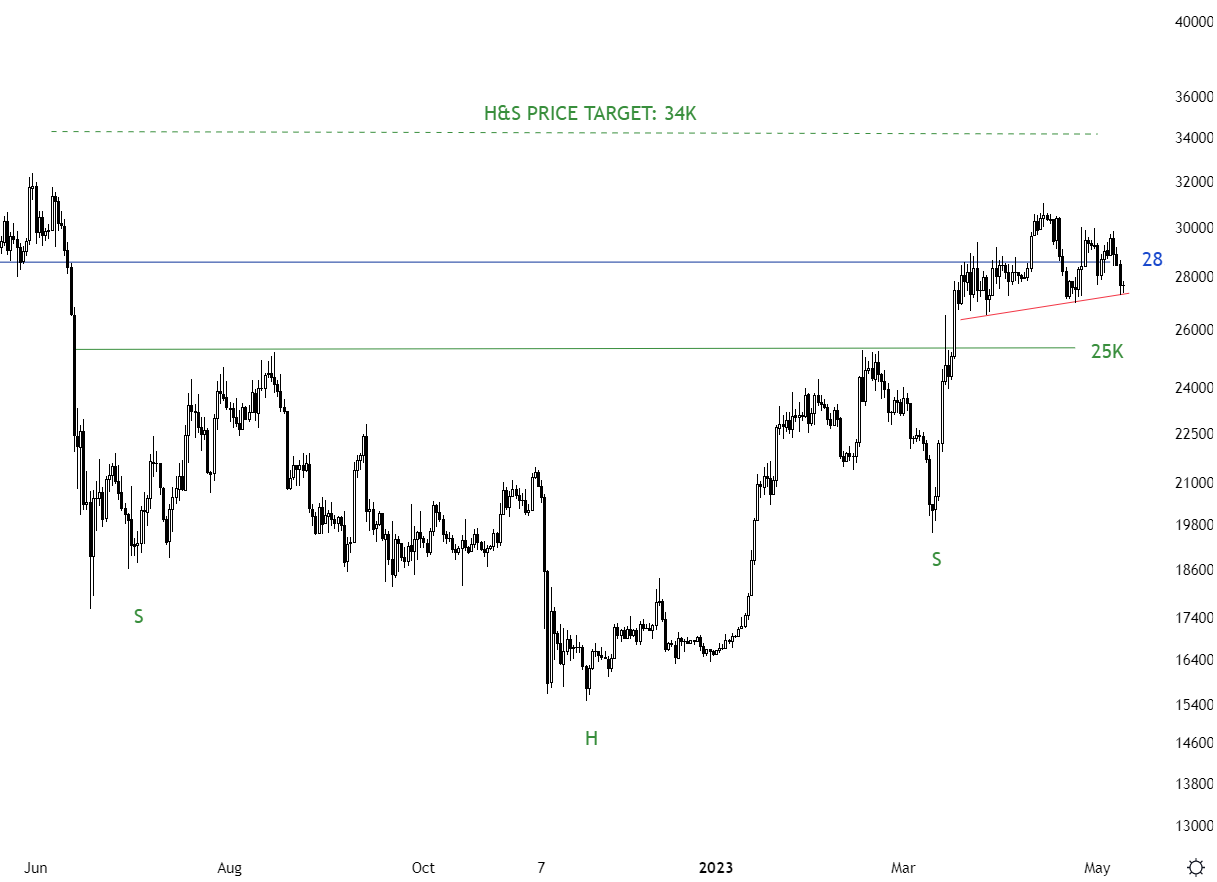
Otherwise, a head & shoulders pattern in the 1-day chart is currently being hotly debated. The bearish side argues that BTC is facing a deeper fall. But, there are also good arguments why this need not be the case.
Chartered Market Technician (CMT) Aksel Kibar makes the argument that chart patterns should be analyzed in relation to the previous price action:
While this last one month consolidation looks like a H&S top, top reversals form after an extended uptrend, as a result can not be analyzed as a top reversal. I’m more interested to play the long side of this one month long consolidation. Support (neckline for bottom reversal) continues to be at 25K.

At press time, the Bitcoin price traded at $27,647.

Featured image from iStock, chart from TradingView.com
Credit: Source link


 Bitcoin
  Ethereum
  Tether
  Solana
  XRP
XRP  Dogecoin
  USDC
USDC  Lido Staked Ether
  Cardano
  TRON
TRON  Shiba Inu
  Avalanche
  Toncoin
  Wrapped Bitcoin
  Wrapped stETH
  Sui
Sui  Chainlink
  WETH
WETH  Bitcoin Cash
  Pepe
Pepe  Polkadot
  LEO Token
  Stellar
  NEAR Protocol
  Litecoin
  Aptos
Aptos  Uniswap
  Wrapped eETH
  USDS
USDS  Hedera
  Cronos
  Internet Computer
  Bonk
Bonk  Render
  Ethereum Classic
  MANTRA
  Bittensor
  POL (ex-MATIC)
  dogwifhat
  Ethena USDe
  Artificial Superintelligence Alliance
  Dai
Dai  WhiteBIT Coin
  Monero
  Stacks
  Arbitrum
  Filecoin
